AI-Powered Decision Support System

Energy Atlas

The unified operations platform rebooting how utilities manage power scheduling, merit order dispatch, trade optimization, and generation analytics. Real-time visibility into every MW dispatched, every rupee earned, every block optimized.

<2%
Demand MAPE
21 days
Go-Live
Explore expand_more
Merit Order Dispatch

Least-Cost Generation Stacking

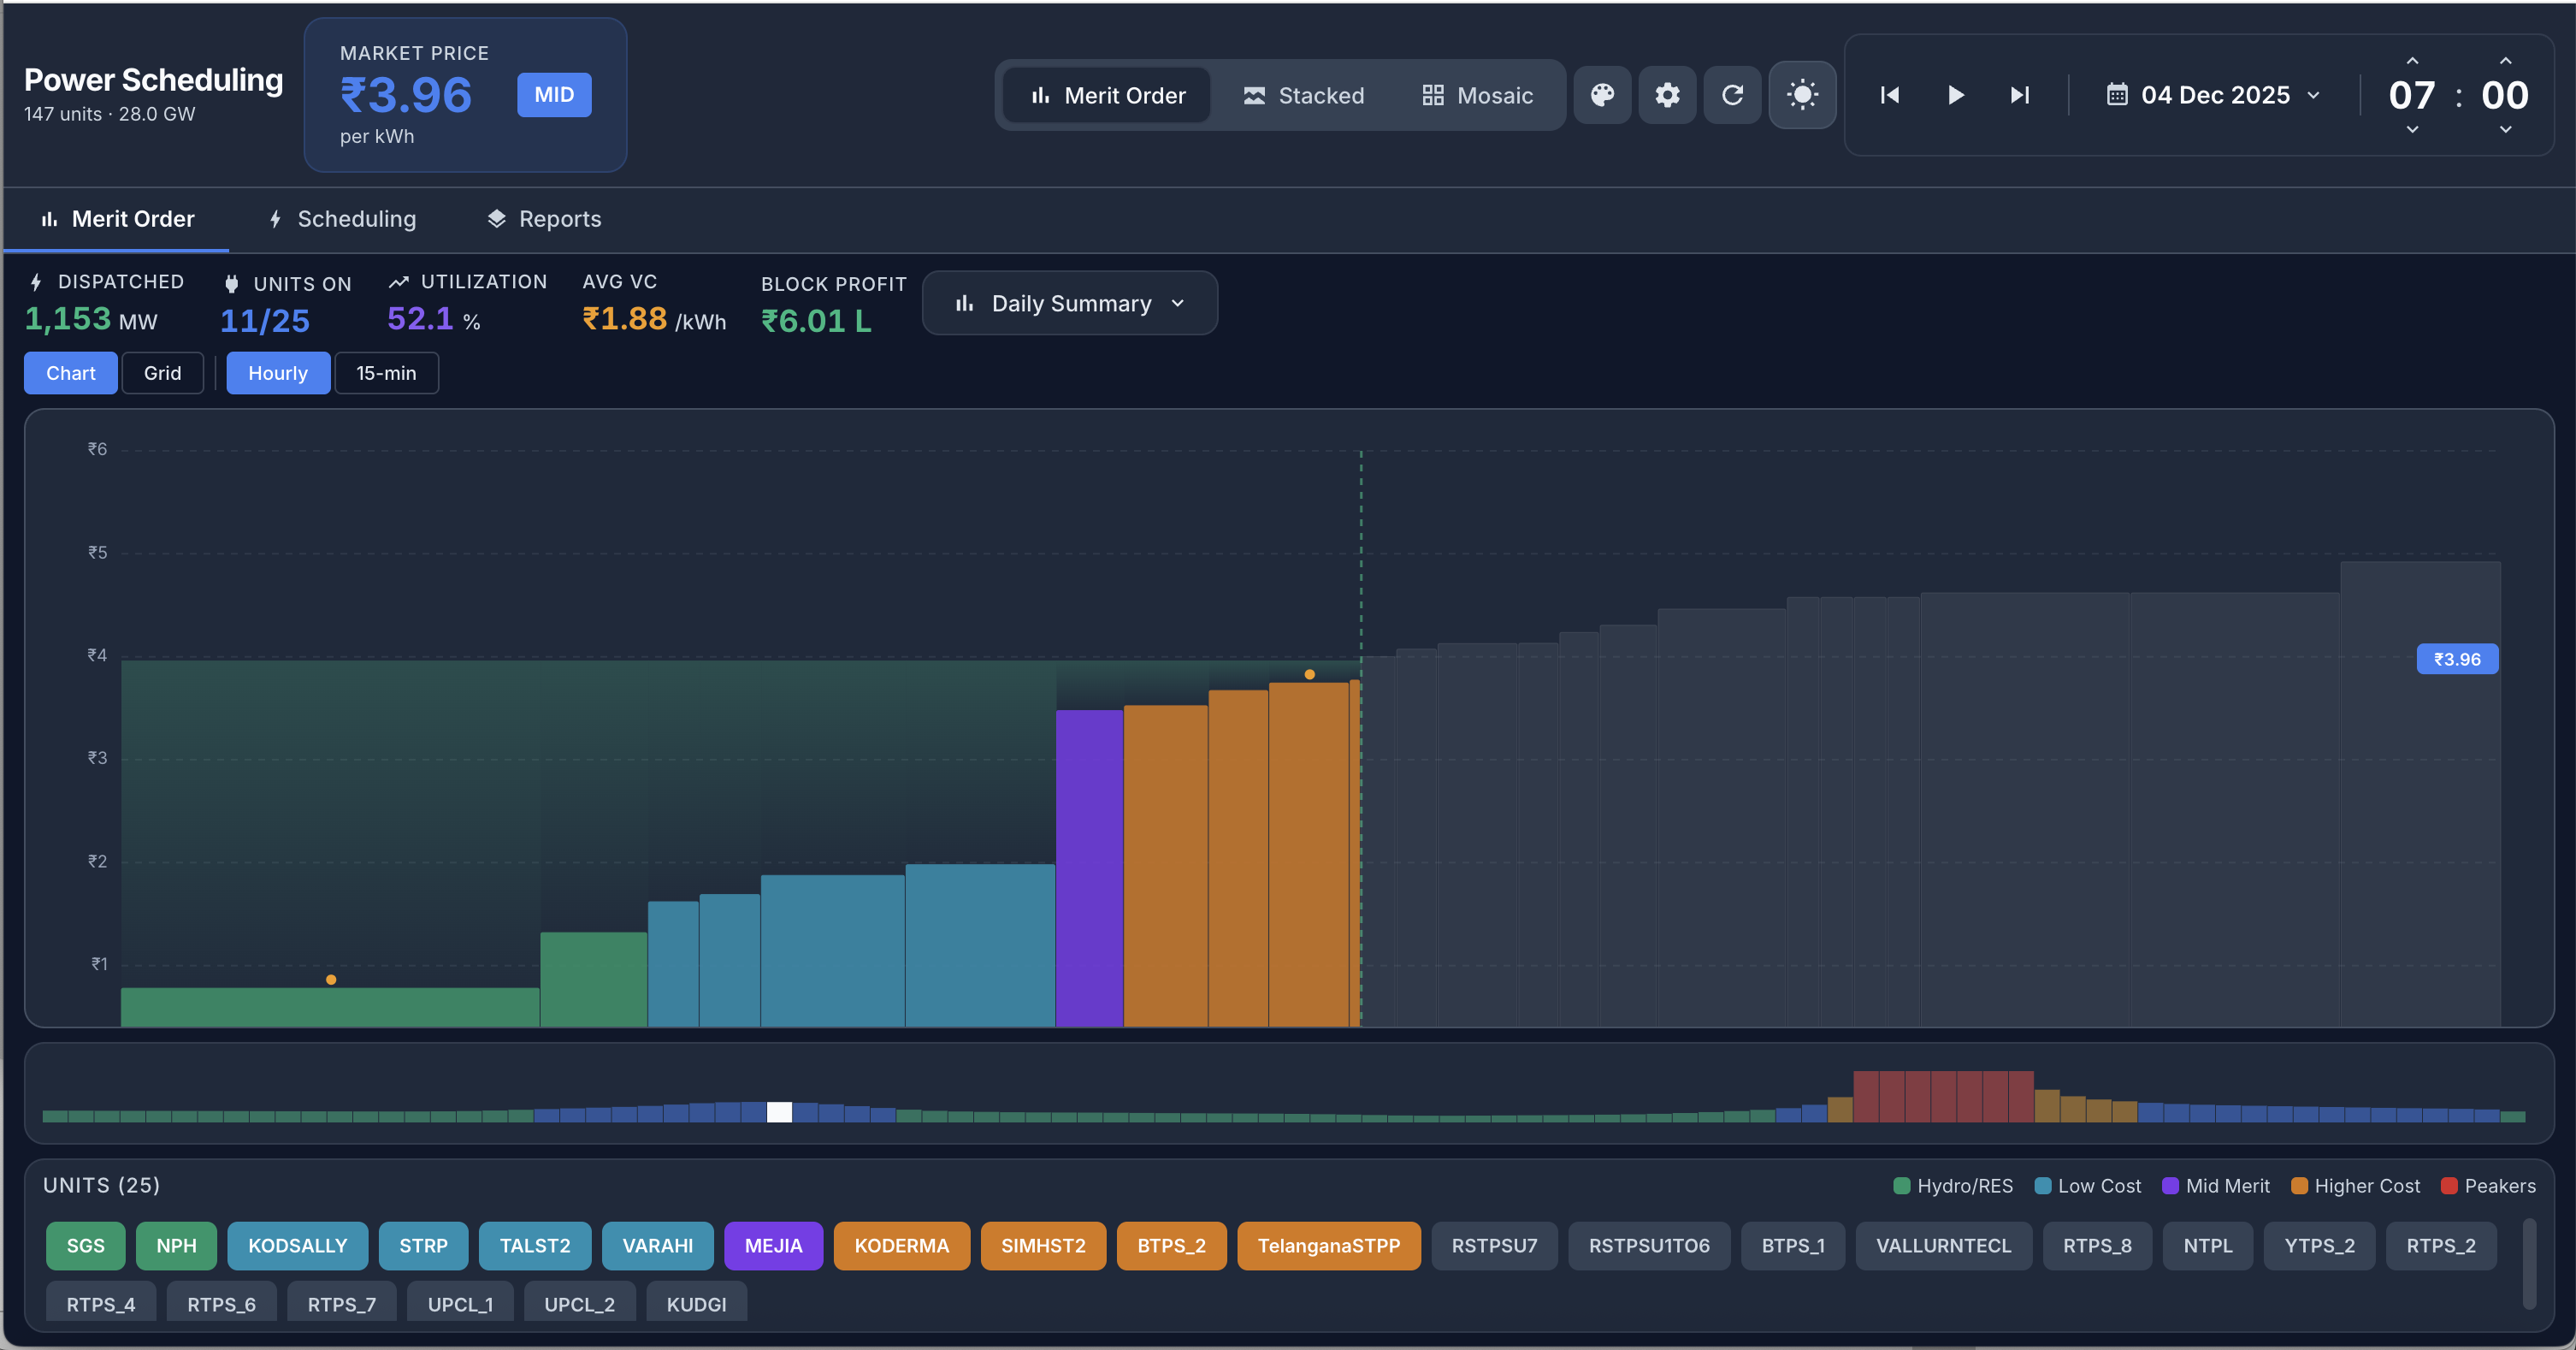
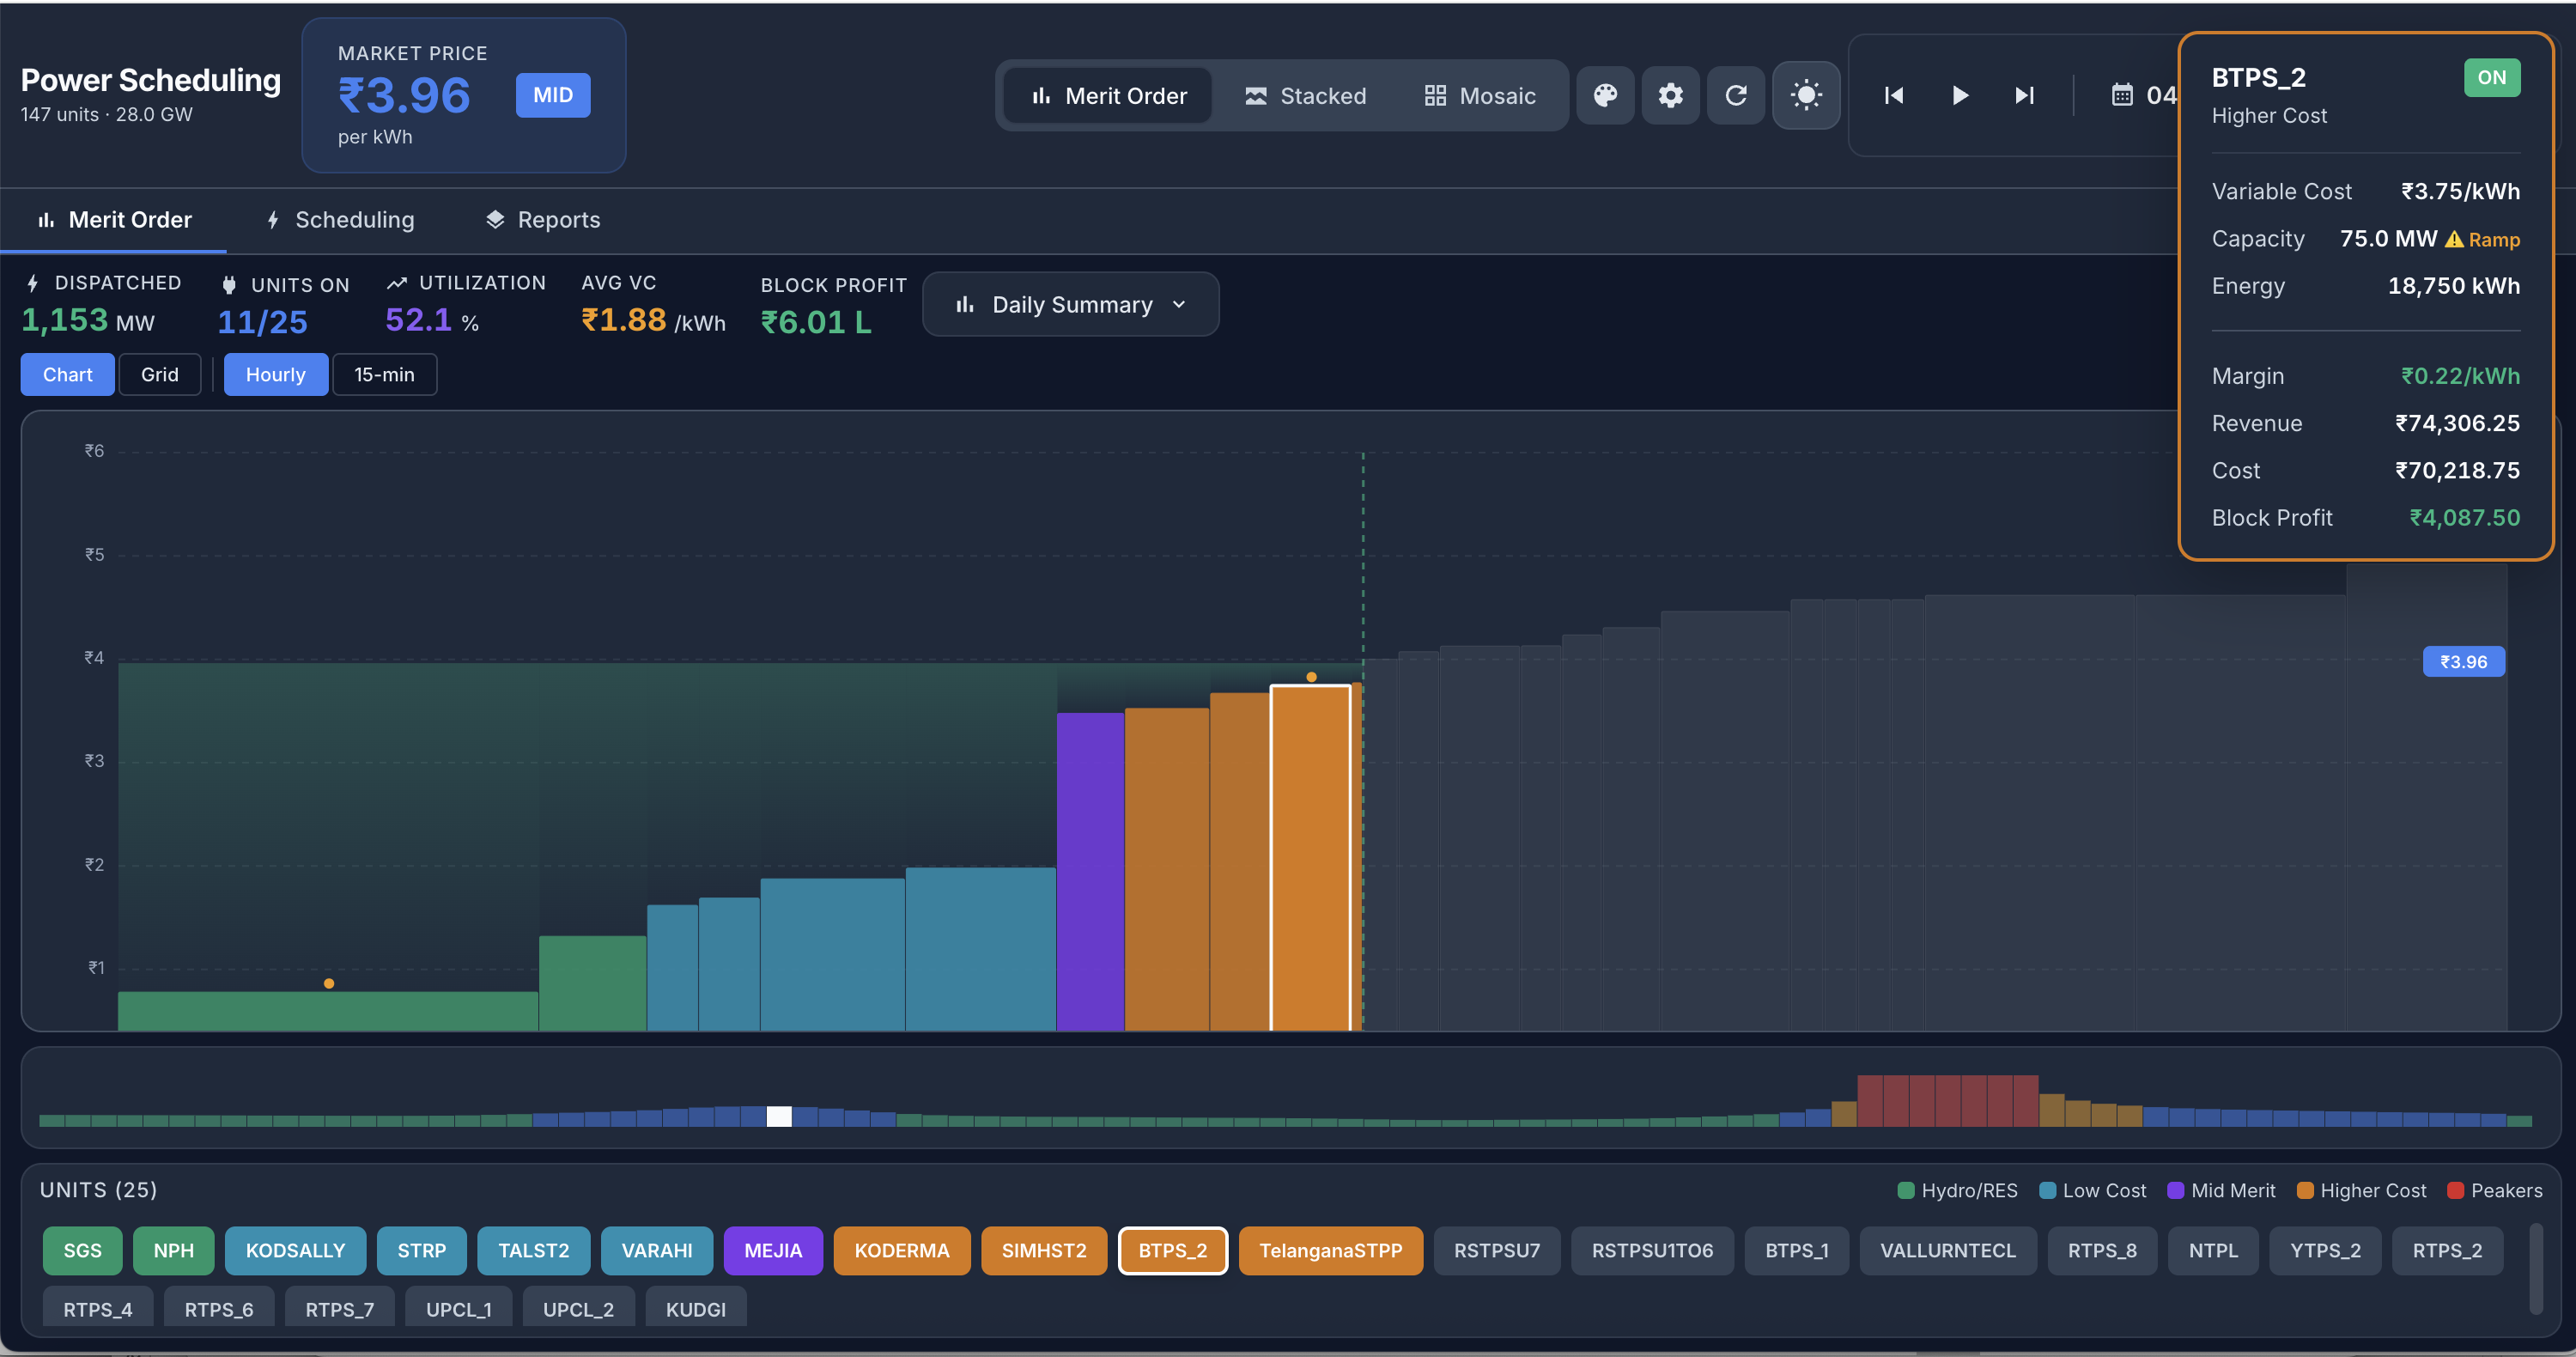
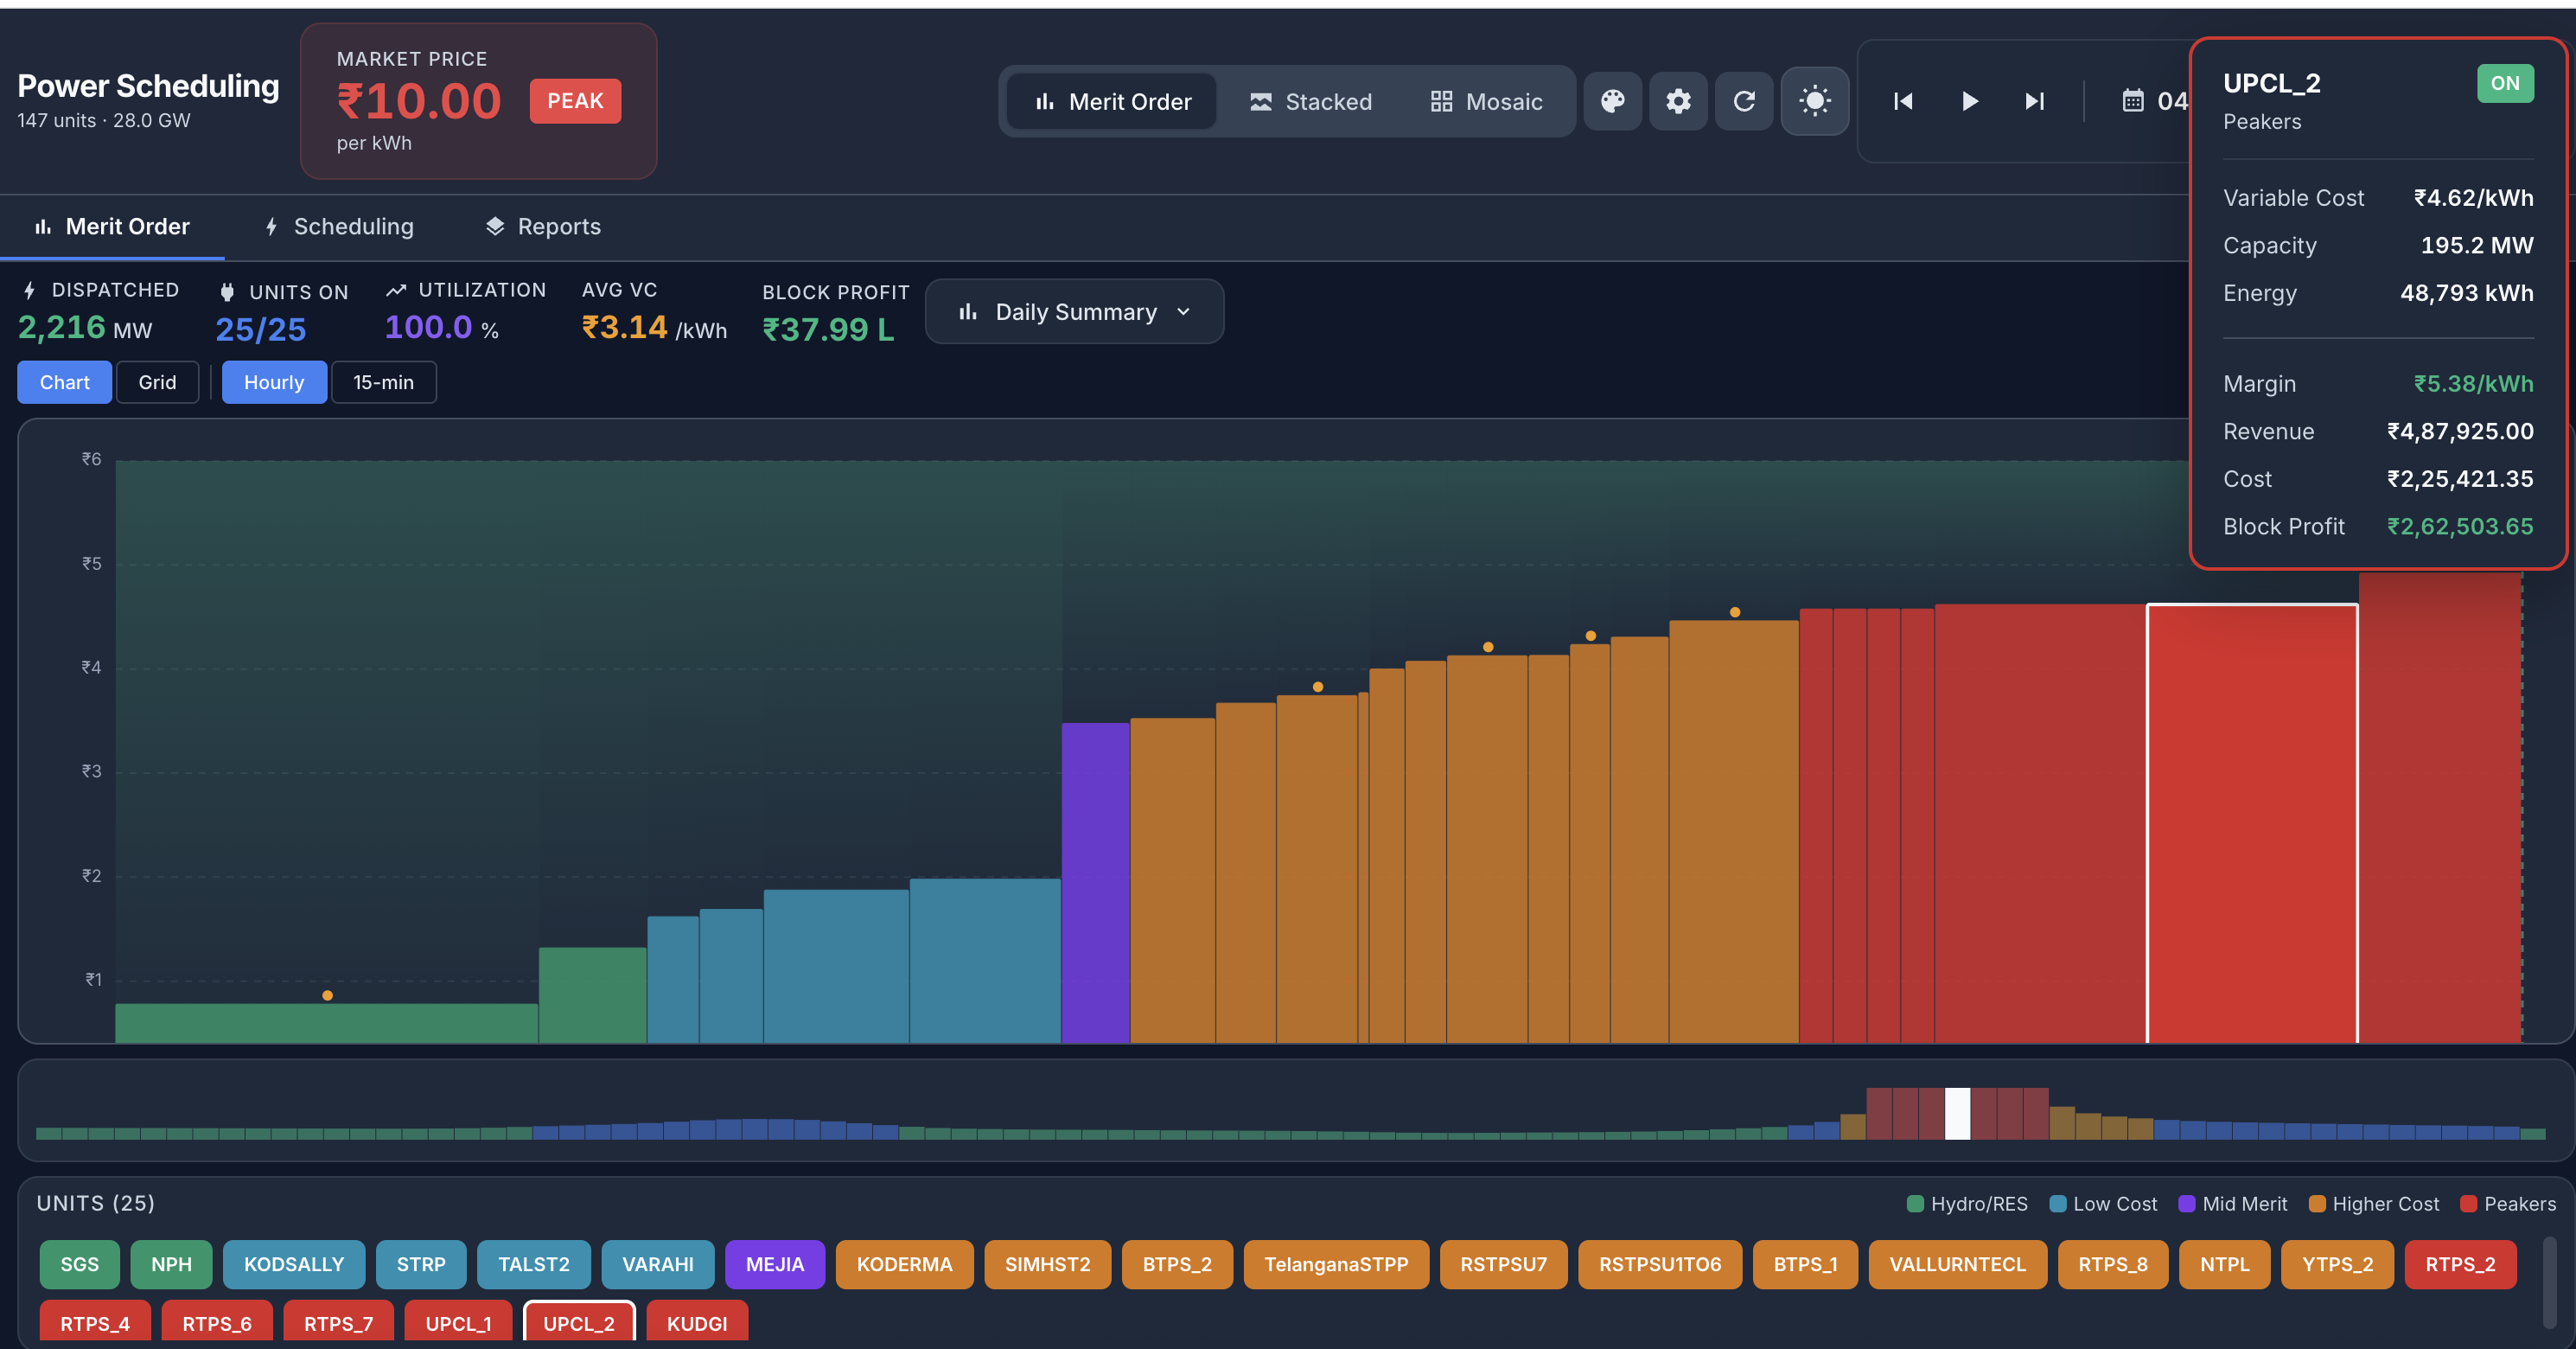
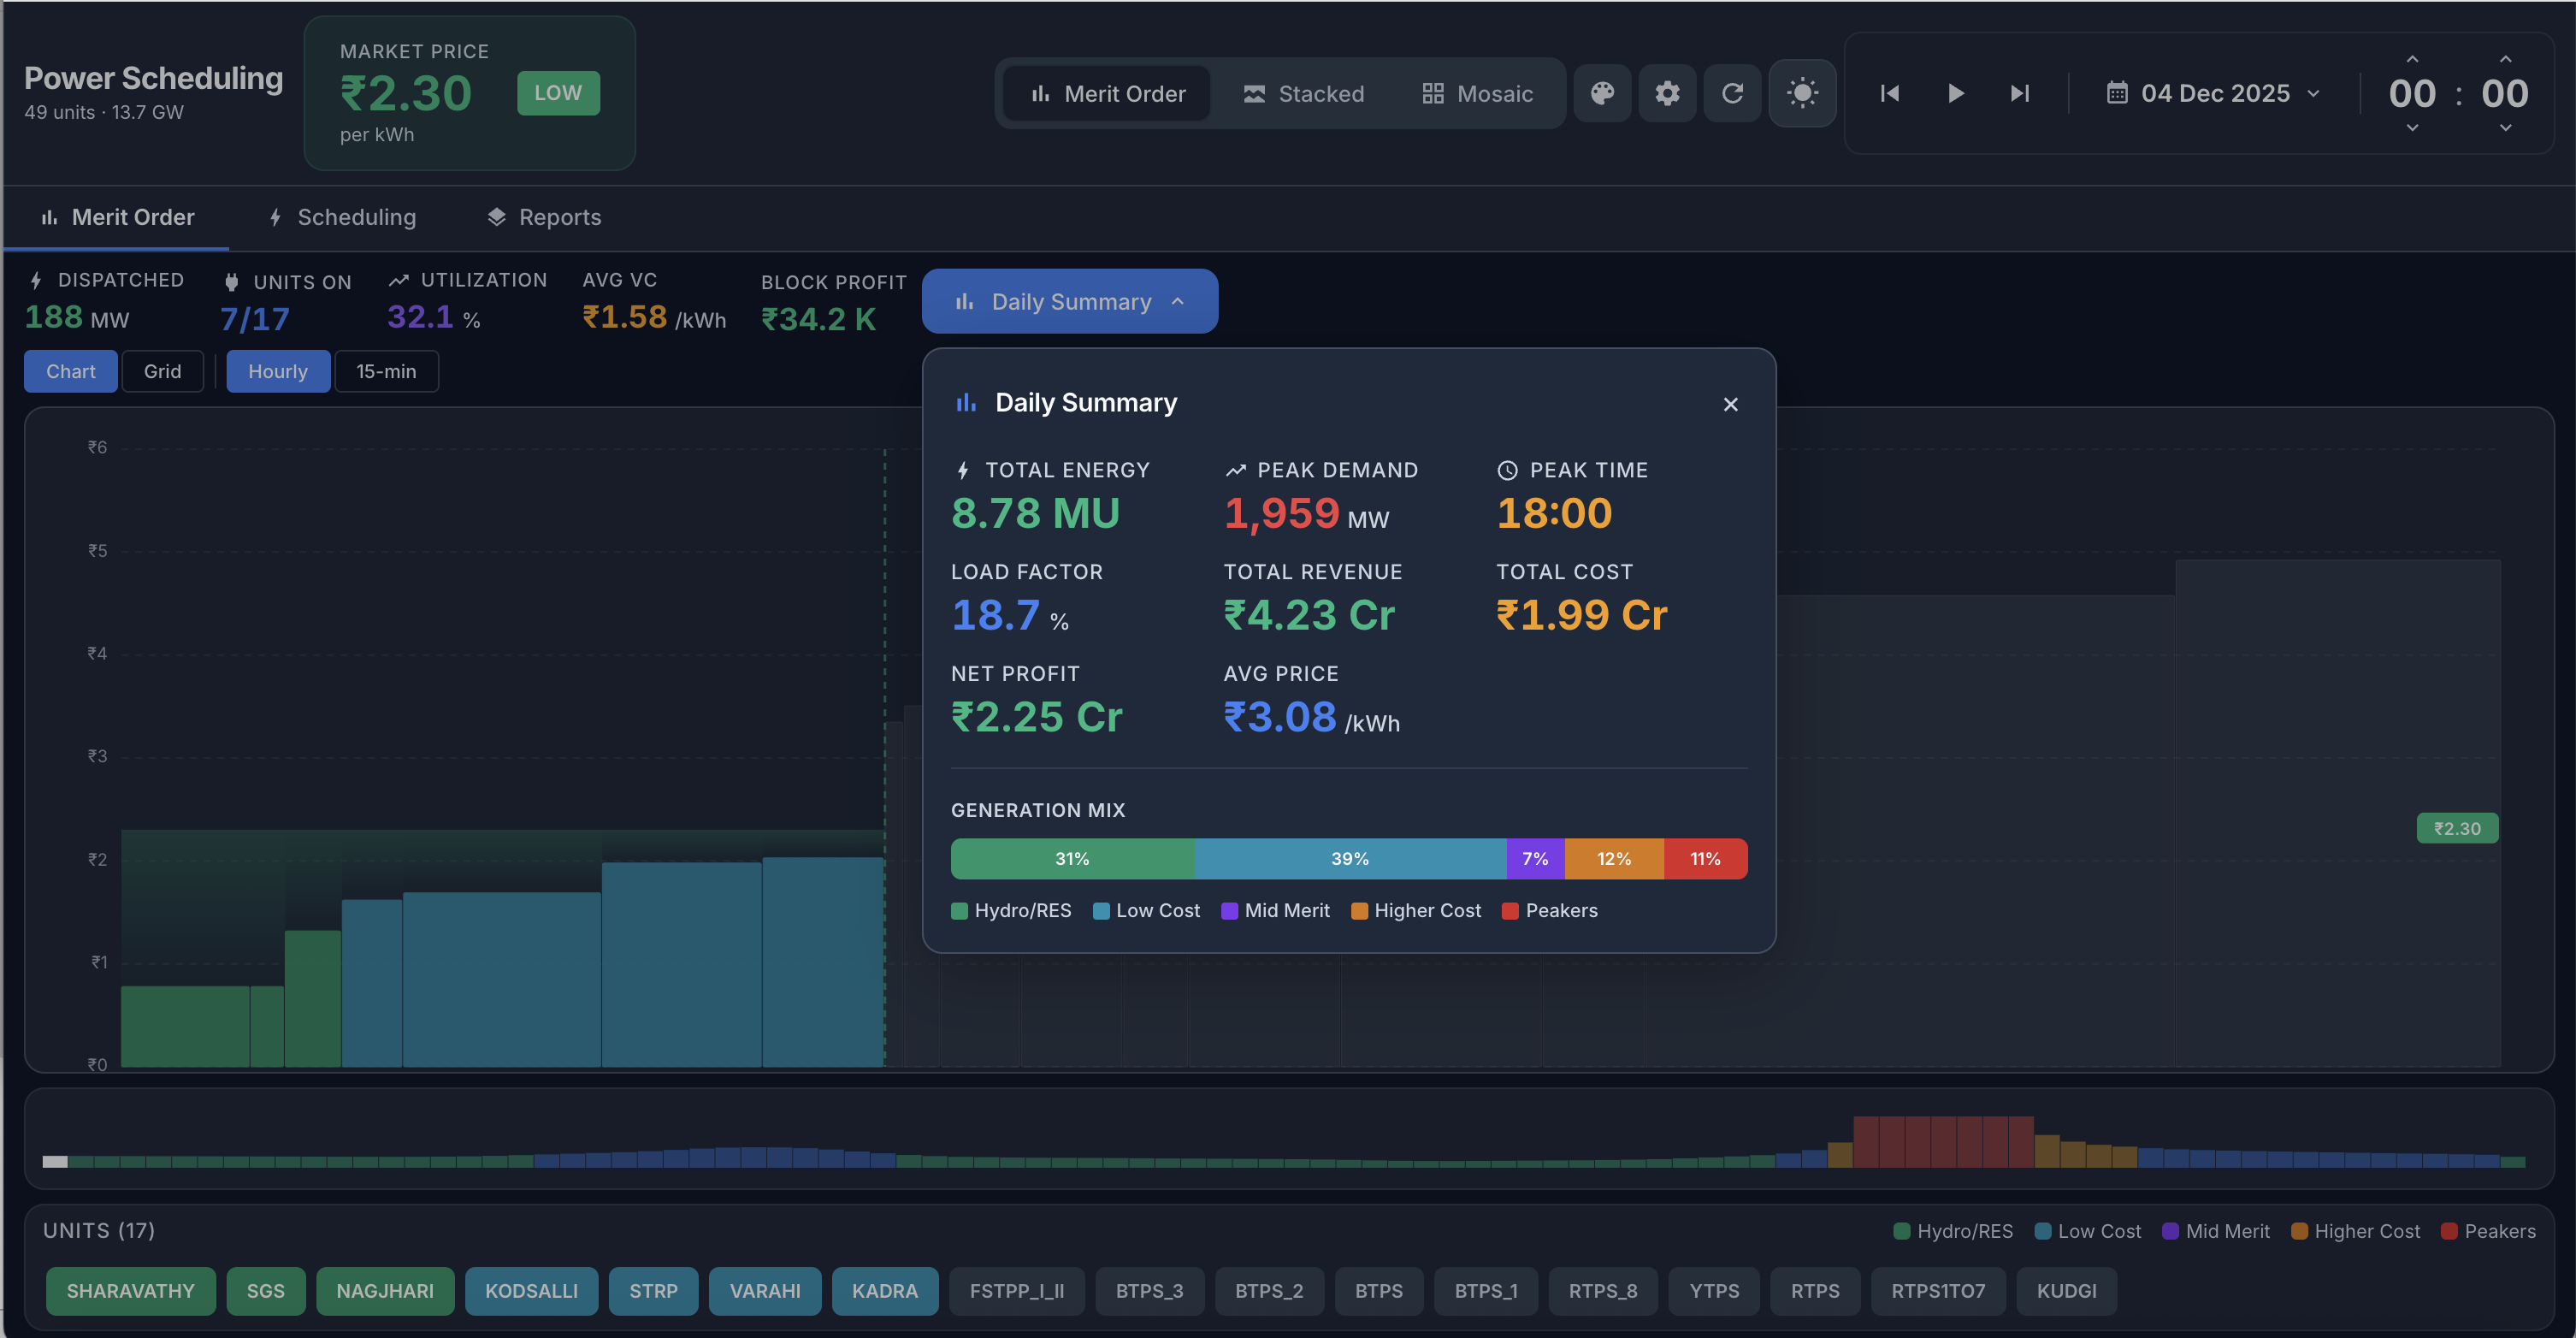
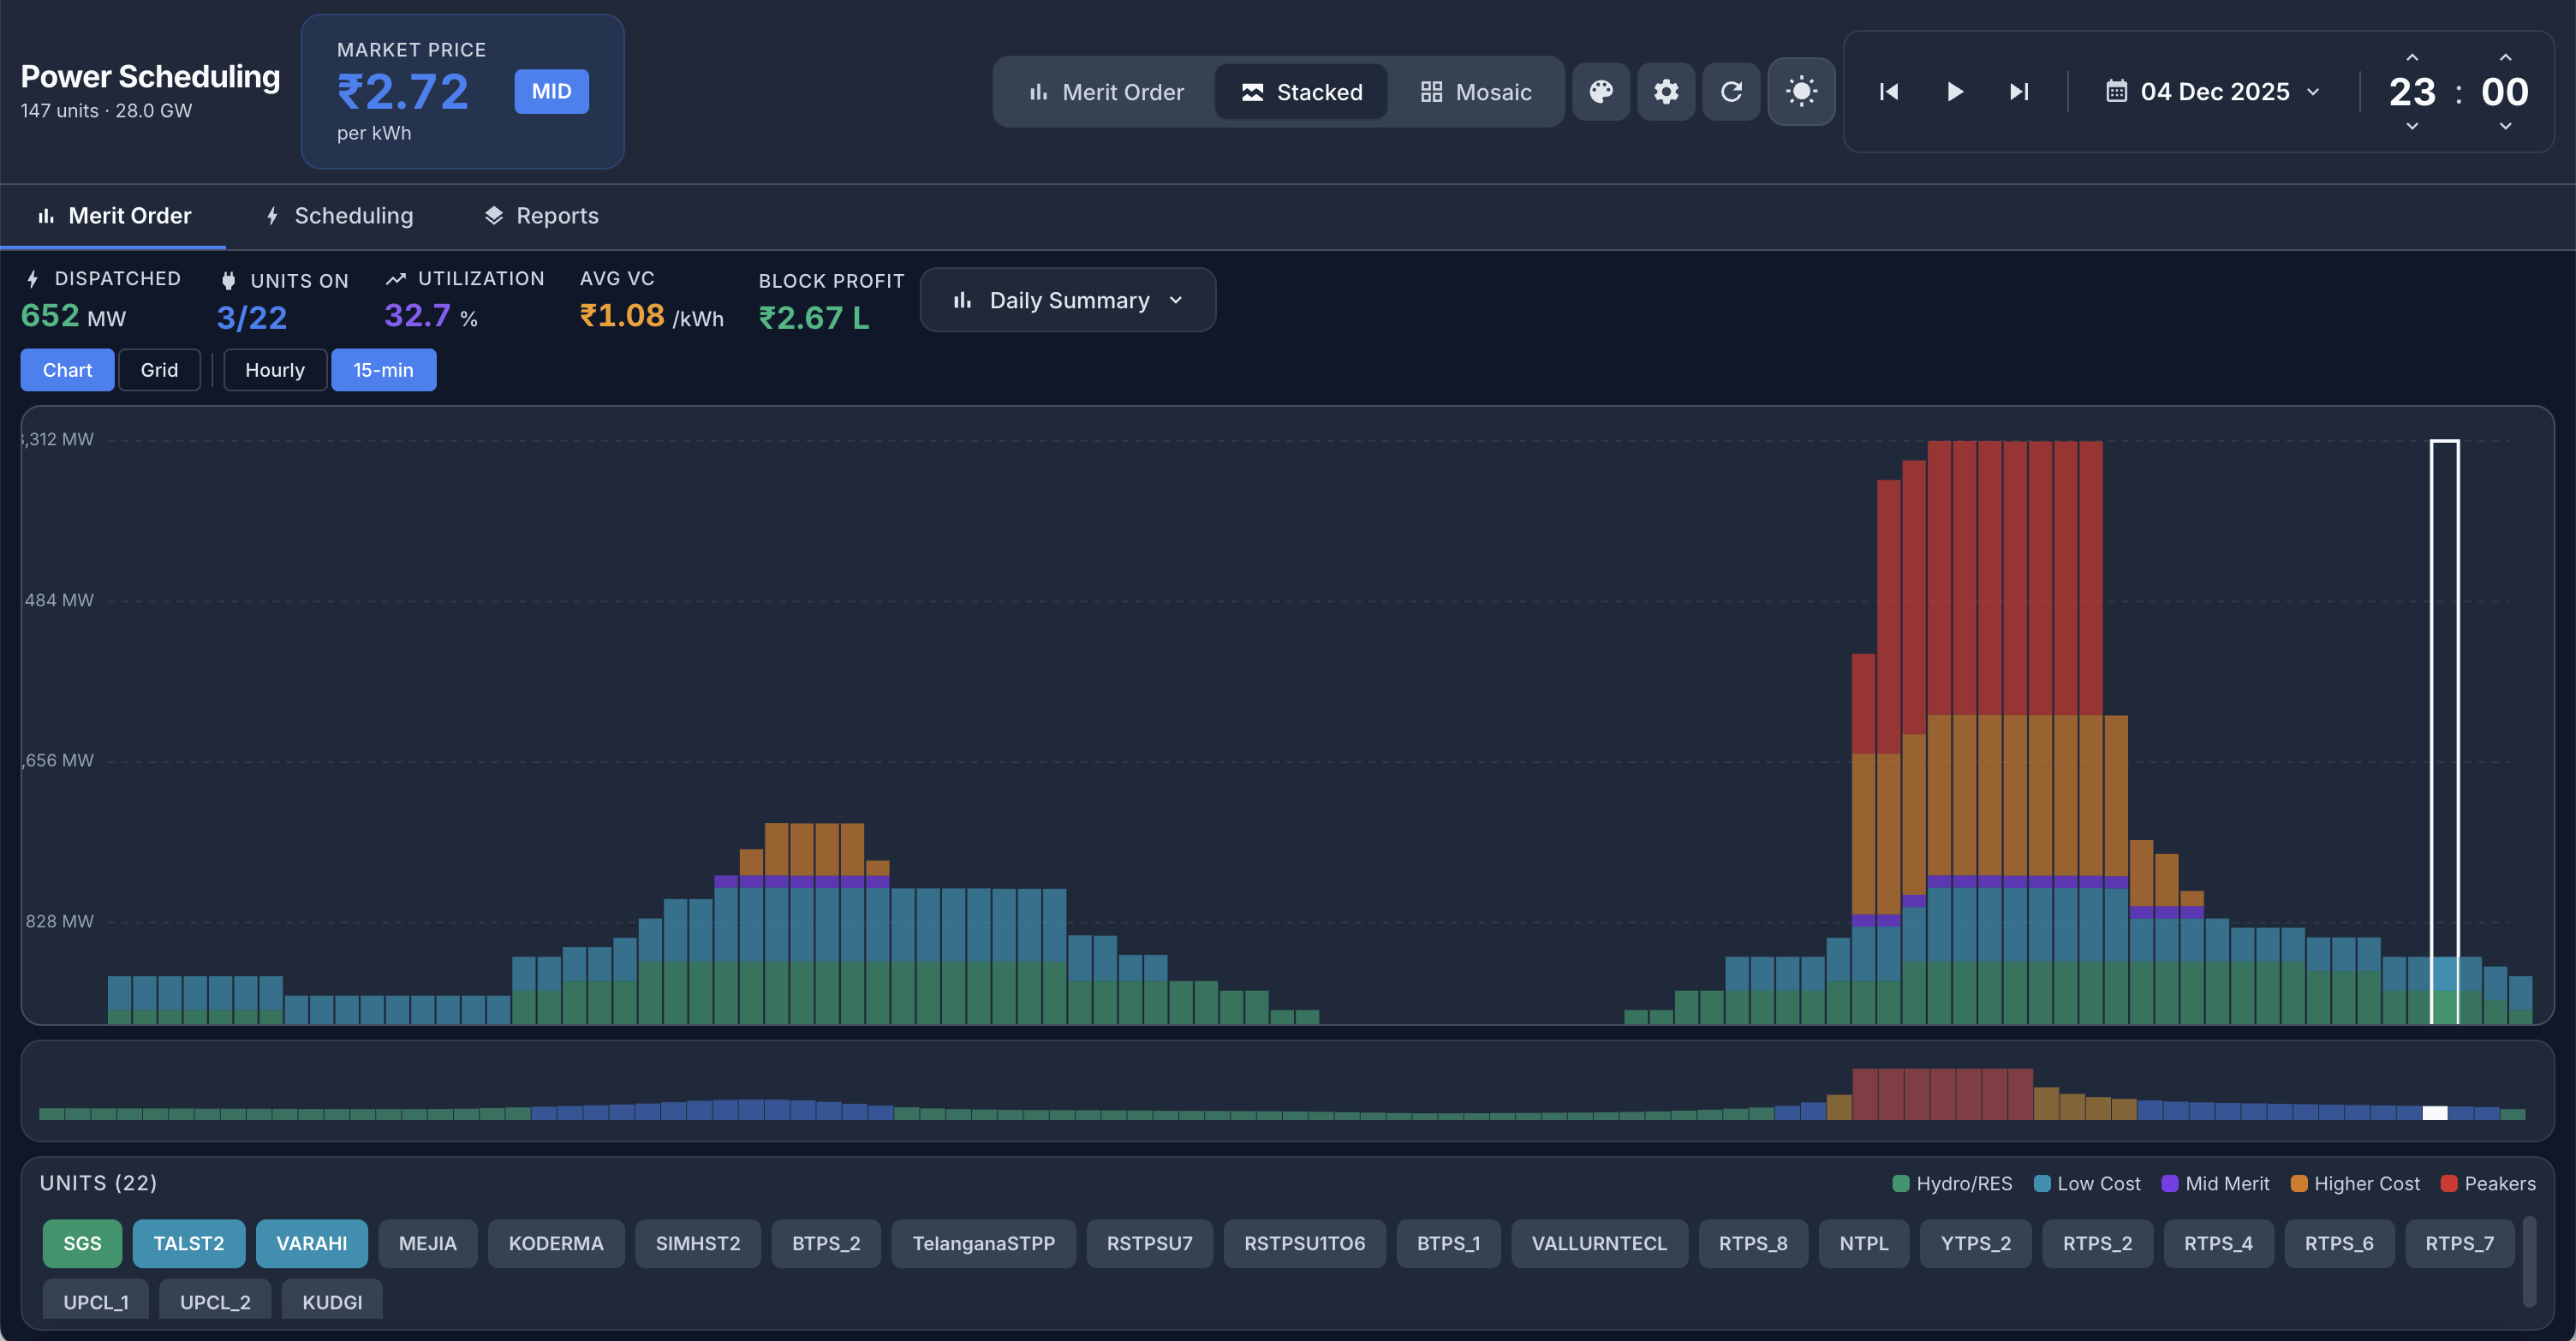
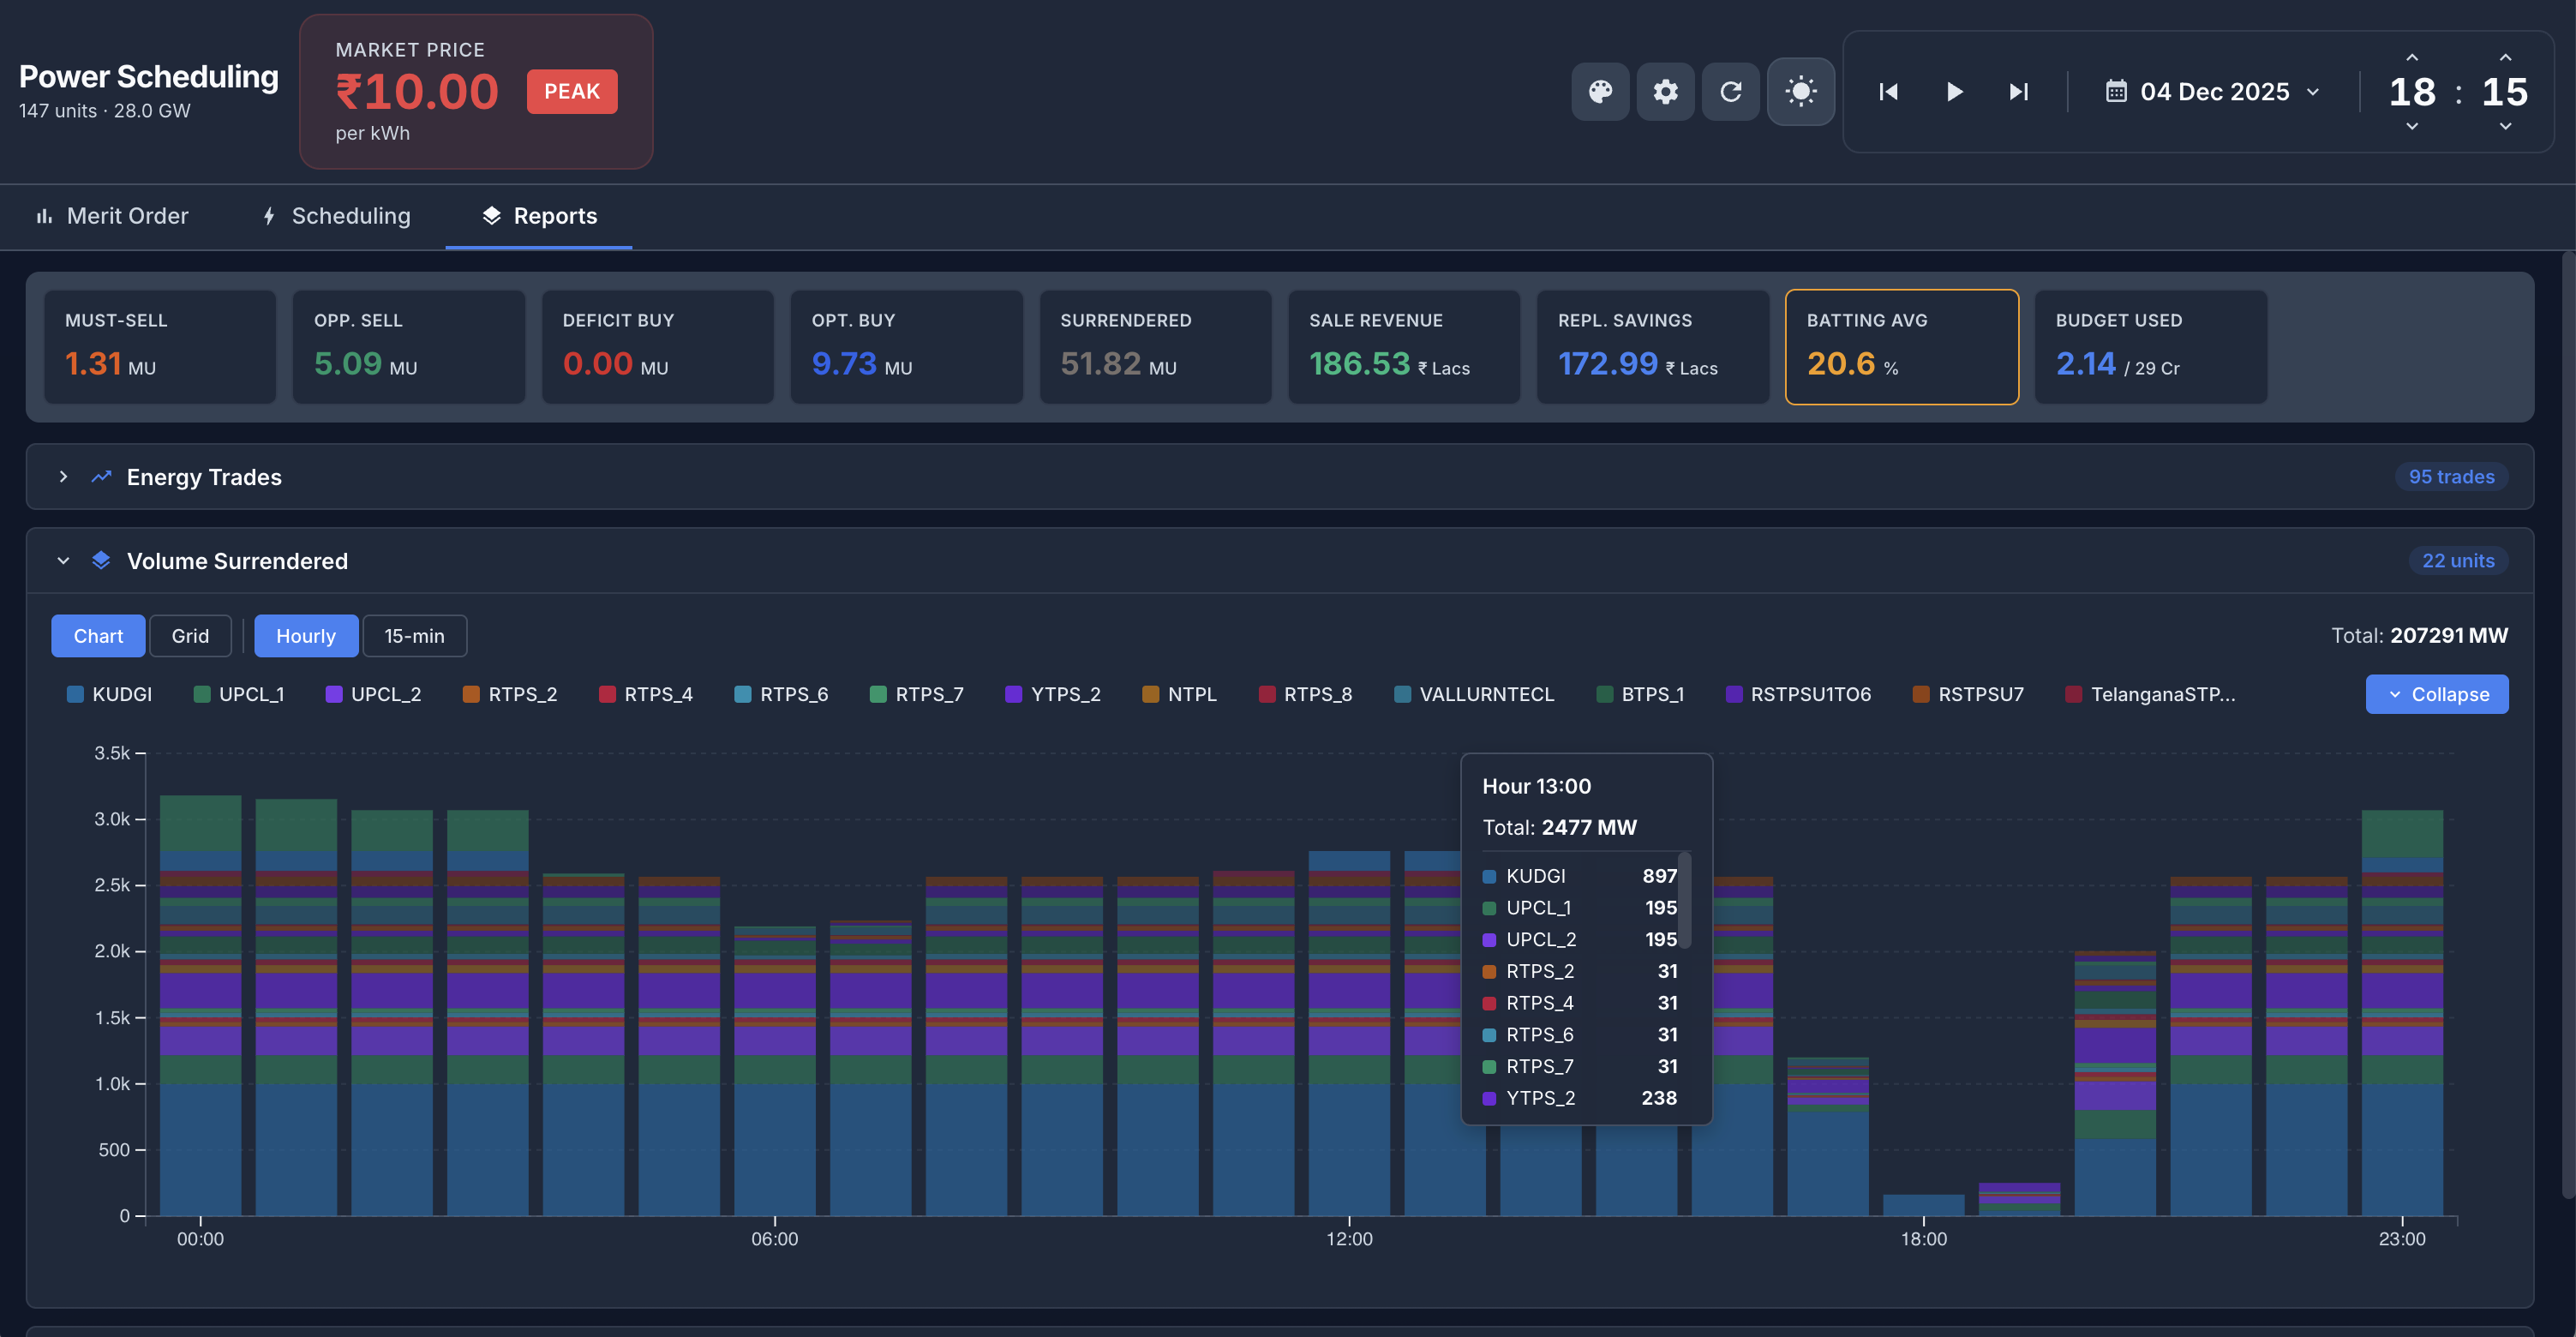
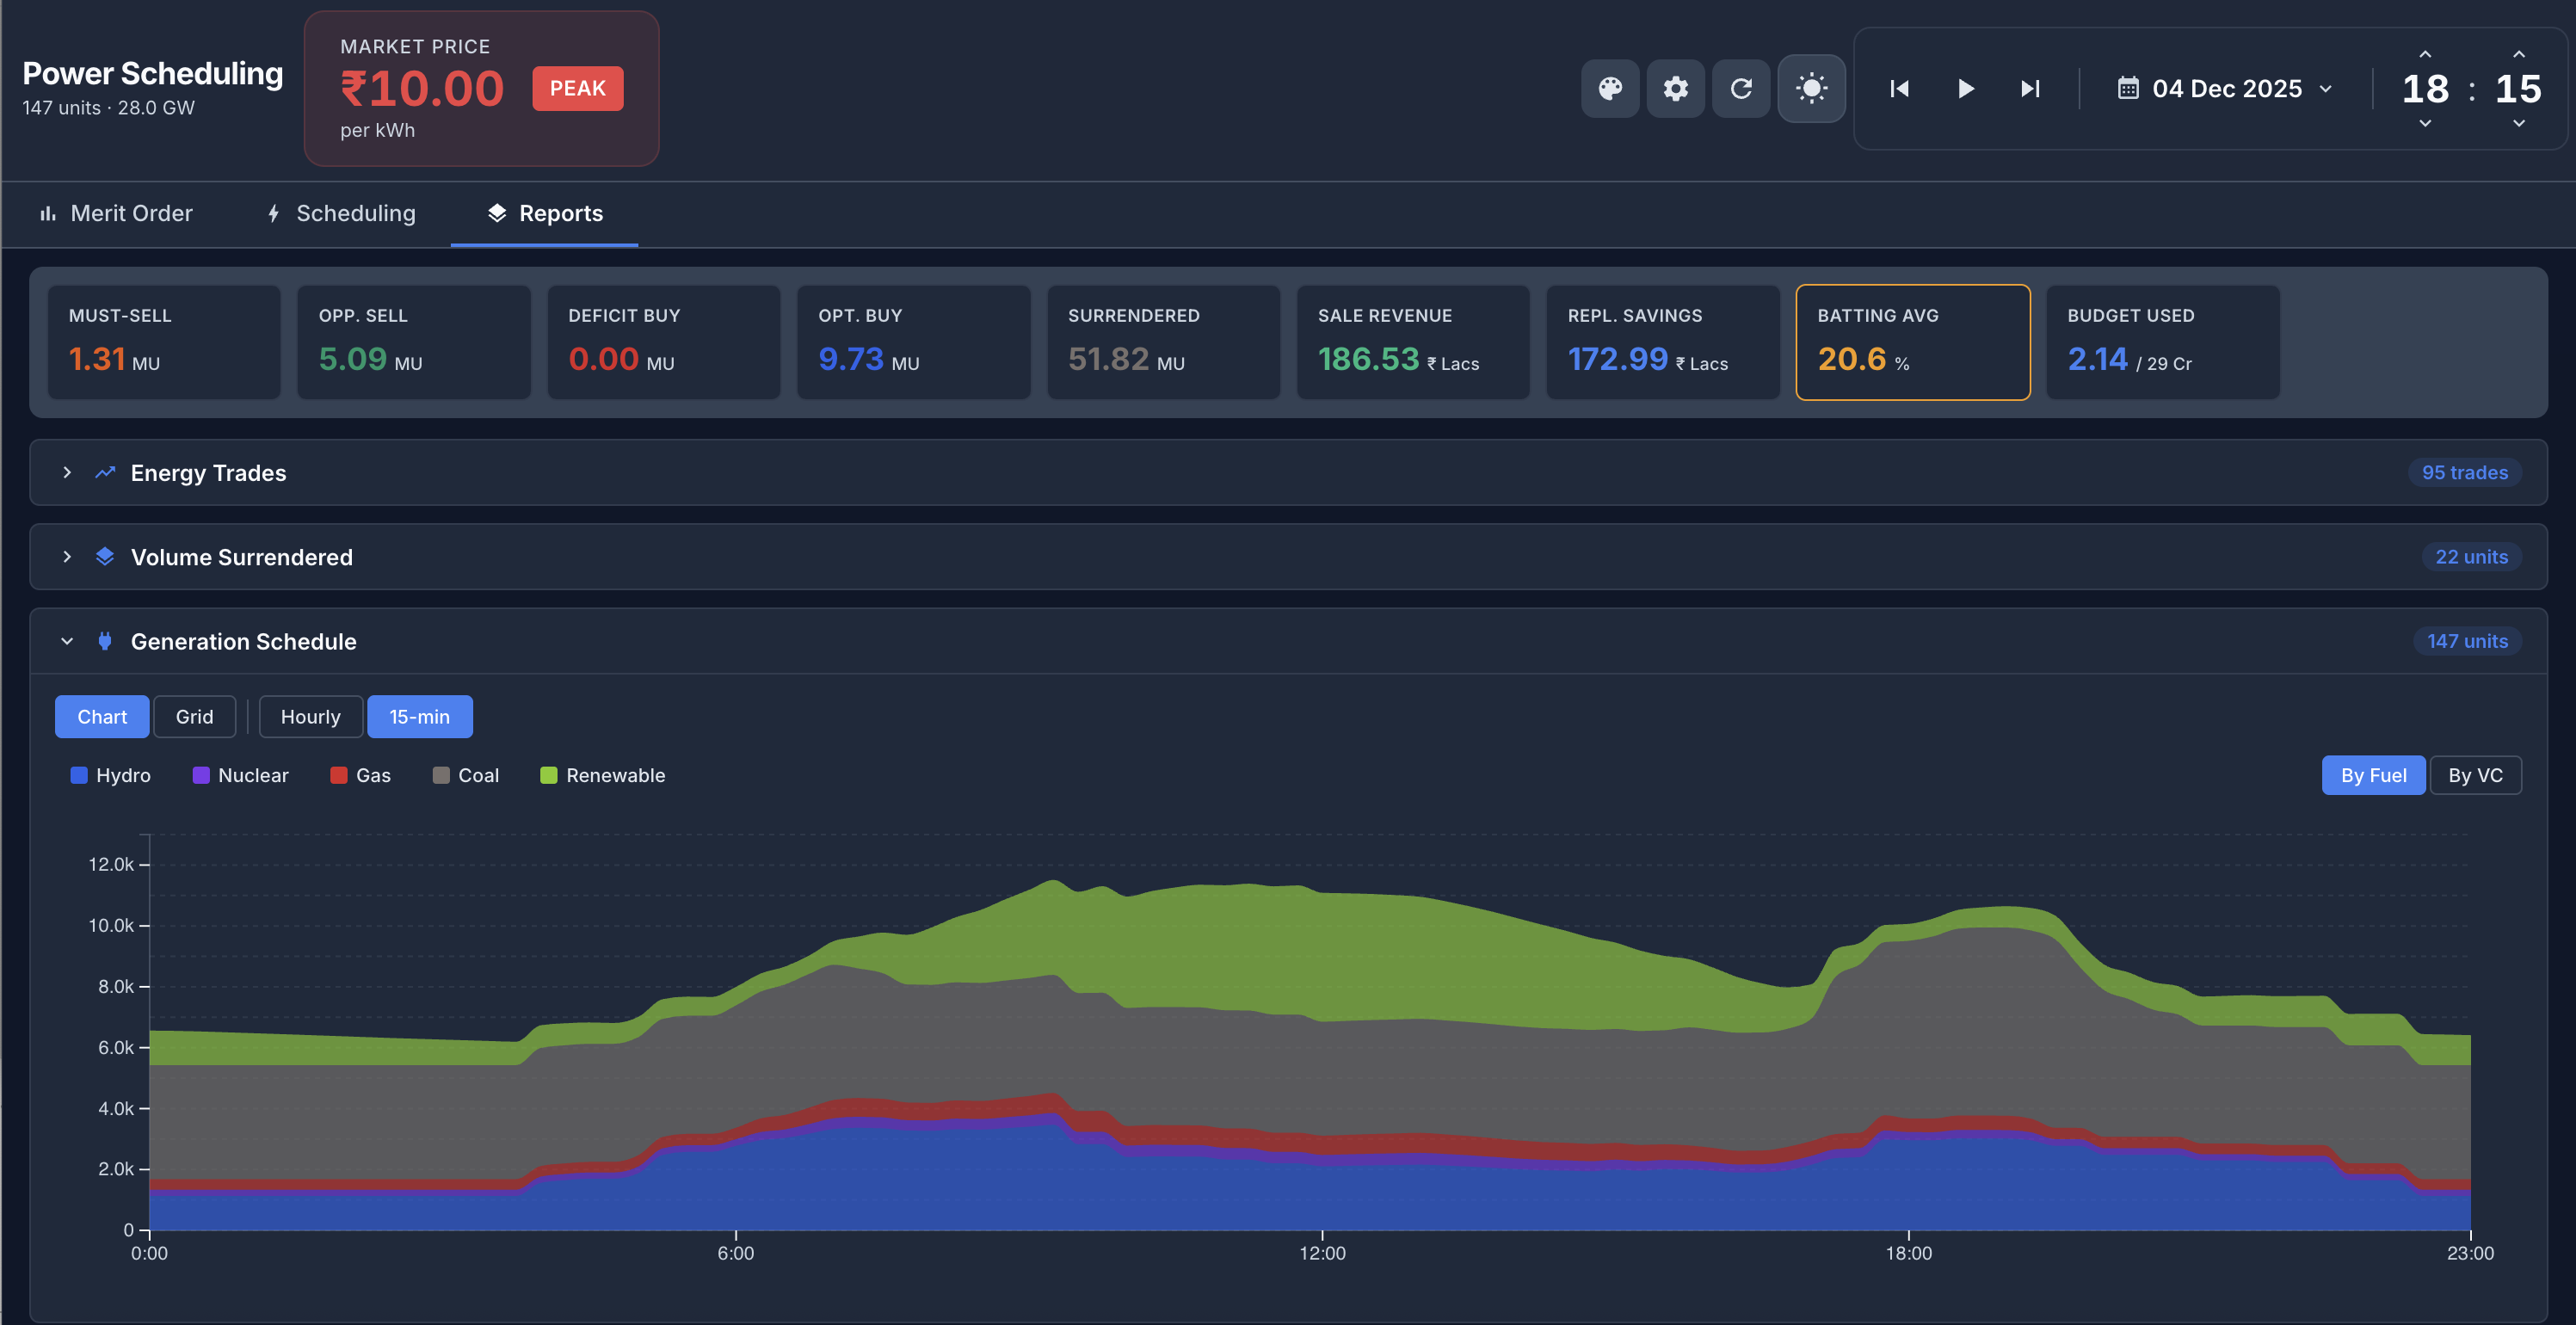
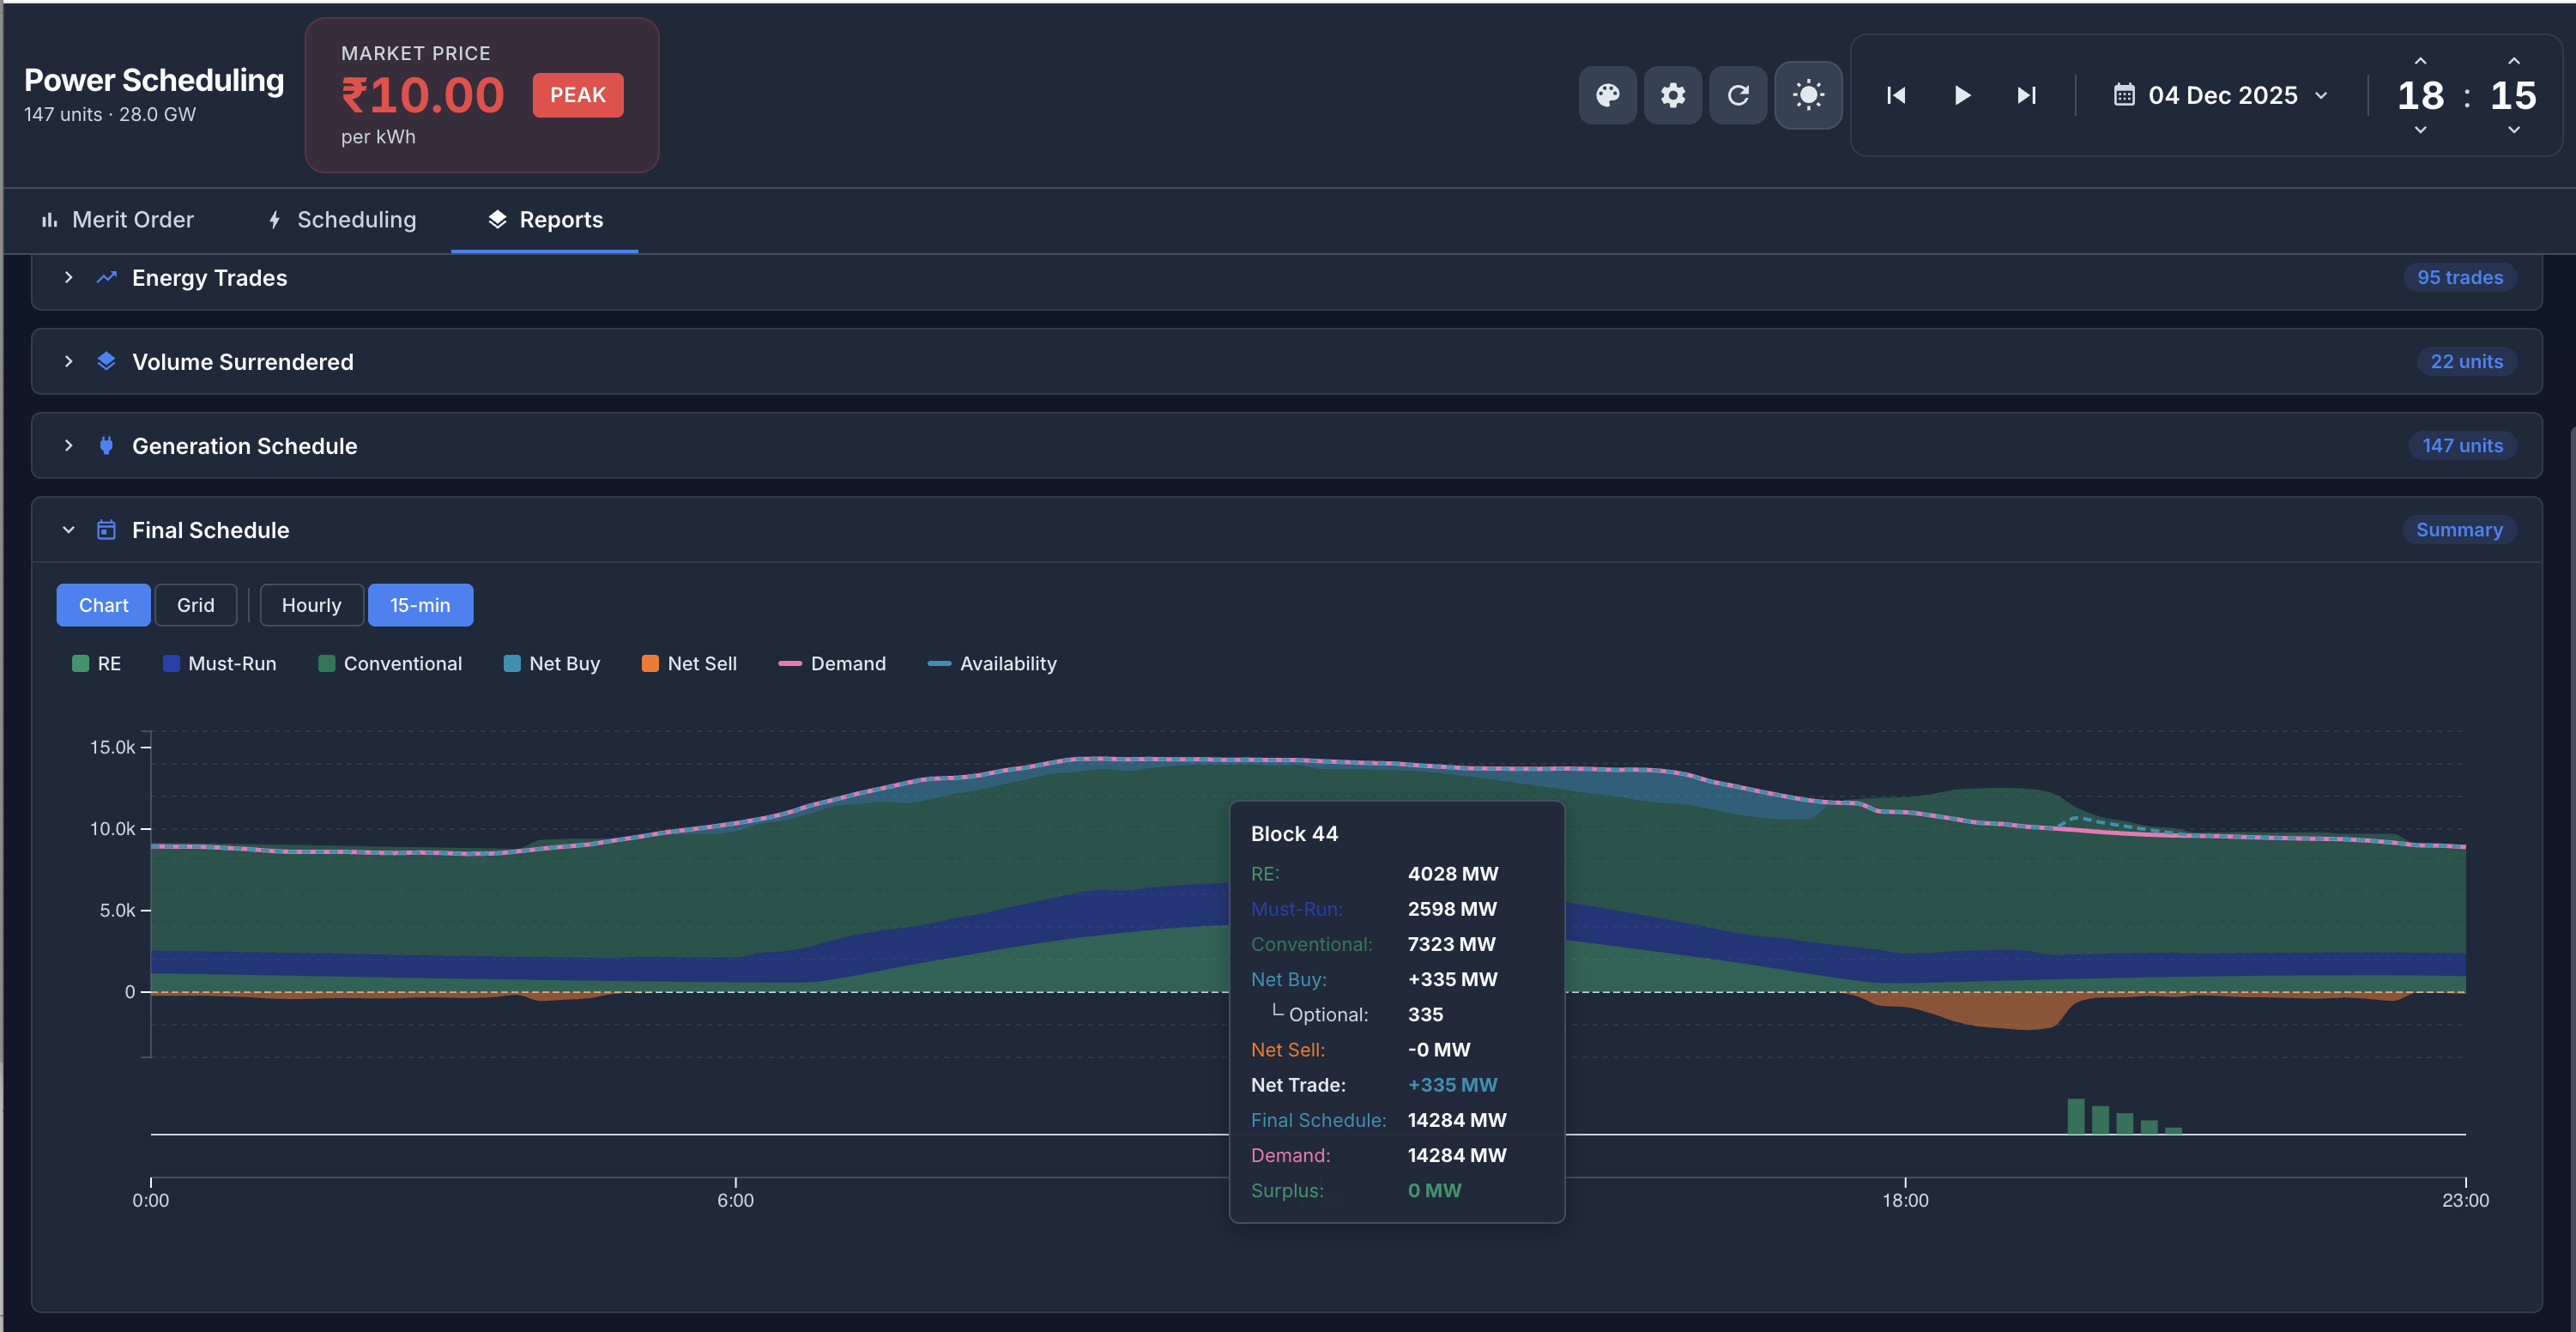
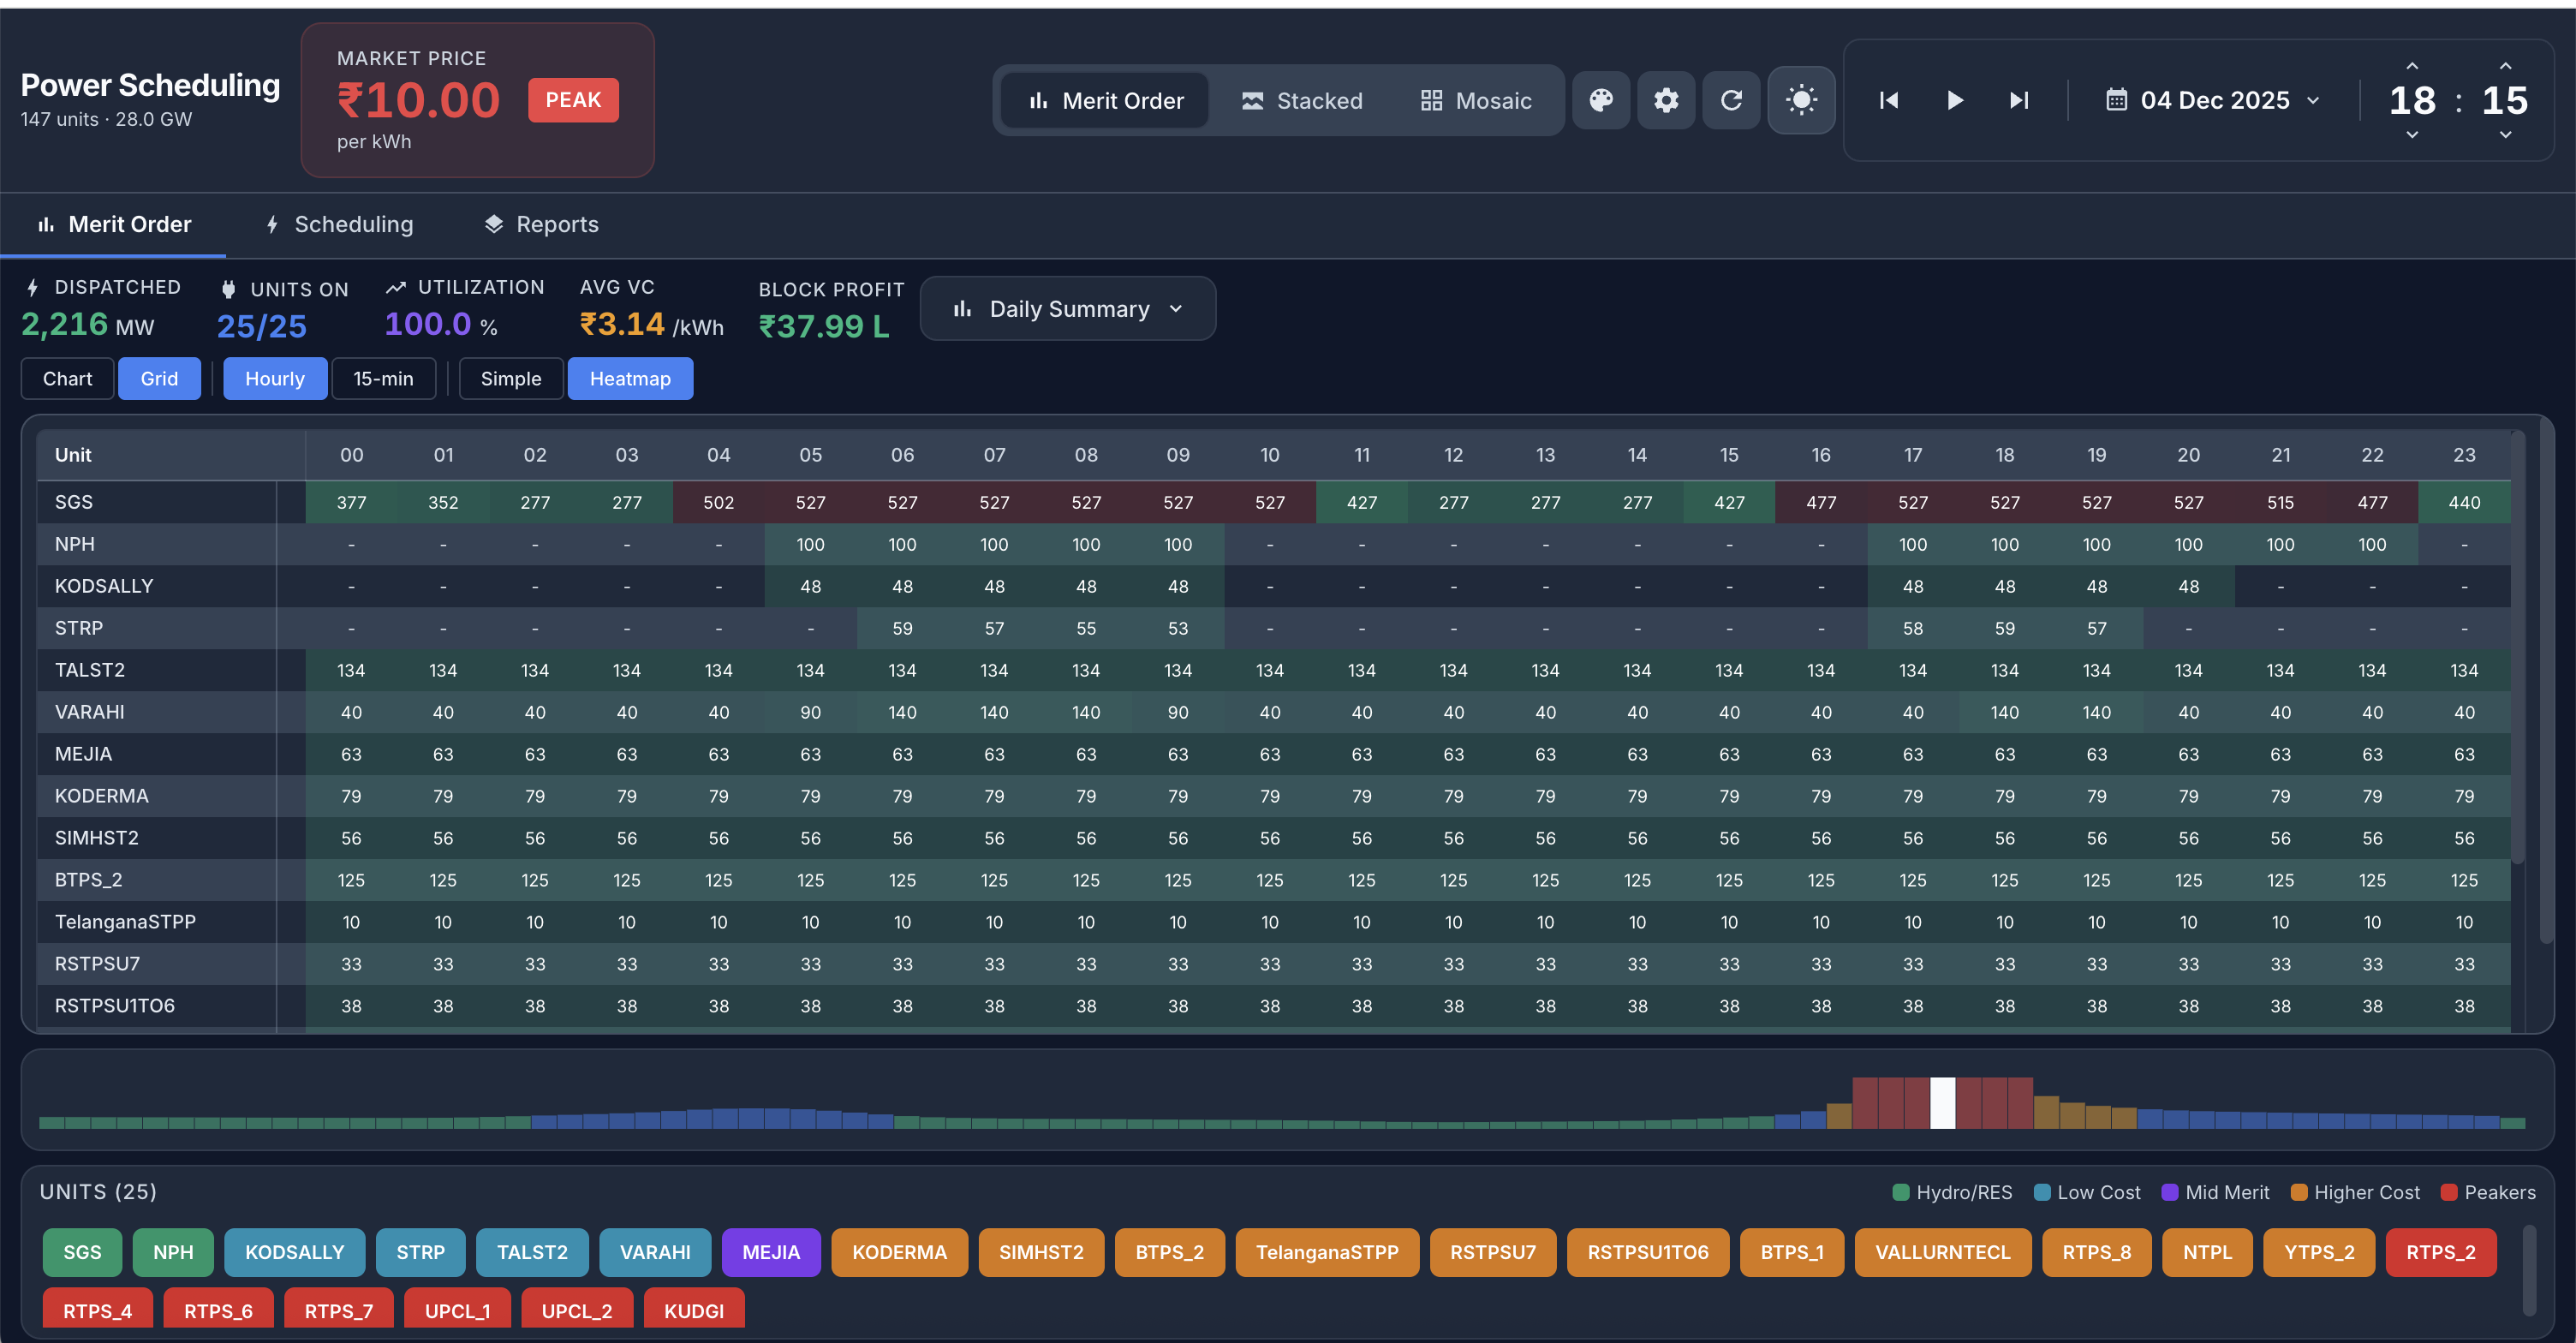
Visualize the complete merit order of all generation units stacked by variable cost — from Hydro/RES at the bottom to Peakers at the top. Hourly and 15-minute views show how the generation mix shifts across the day as demand rises and falls.

  • stacked_bar_chart Color-coded cost categories: Hydro/RES, Low Cost, Mid Merit, Higher Cost, Peakers
  • bolt Real-time dispatched MW, units online, and utilization percentage
  • currency_rupee Avg variable cost (₹/kWh) and block profit tracked continuously
  • schedule Toggle between Chart, Grid, Hourly, and 15-min granularity
Energy Atlas Merit Order — stacked bar chart showing generation units by cost category
Unit Economics

Per-Unit Margin & Profit Analysis

Click any generation unit to see its complete economics — variable cost, capacity, energy output, margin per kWh, revenue, cost, and block profit. Instantly identify which units are profitable and which are margin-negative at current market prices.

  • analytics Margin (₹/kWh), Revenue, Cost, and Block Profit per unit
  • power Capacity (MW), Energy (kWh), and ON/OFF status at a glance
  • trending_up Mid Merit units at ₹3.75/kWh earning ₹4,087 per block
  • warning Peaker units at ₹4.62/kWh with ₹2.62L block profit during peak
Energy Atlas unit detail popup showing margin, revenue, cost and block profit for BTPS_2
Peak Management

100% Utilization at Peak

During peak hours (₹10/kWh), all 25 units are dispatched at 100% utilization generating 2,353 MW. The merit order stacking reveals the true cost structure — and which peaker units drive the marginal price higher. Block profit hits ₹41.16L.

  • electric_meter 2,353 MW dispatched — 25/25 units online at 100% utilization
  • currency_rupee Market price ₹10.00/kWh (Peak) vs Avg VC ₹3.00/kWh
  • savings Block profit ₹41.16L — massive margin during peak demand
  • stacked_bar_chart Peaker stack (red) visible only during high-demand blocks
Energy Atlas peak hour with all 25 units at 100% utilization generating 2353 MW
Daily Intelligence

Daily Summary Dashboard

One-click daily summary showing total energy, peak demand, peak time, load factor, total revenue, total cost, net profit, average price, and the generation mix breakdown — everything a utility COO needs in a single view.

  • electric_bolt Total Energy: 8.78 MU with Peak Demand of 1,959 MW at 18:00
  • account_balance Total Revenue ₹4.23 Cr vs Total Cost ₹1.99 Cr = Net Profit ₹2.25 Cr
  • donut_large Generation Mix: Hydro/RES 35%, Low Cost 38%, Mid Merit 7%, Higher 12%, Peakers 11%
  • percent Load Factor 18.7% with Avg Price ₹3.08/kWh
Energy Atlas daily summary showing total energy, revenue, cost, net profit and generation mix
15-Minute Resolution

Block-Level Granularity

Drill down to 15-minute trading blocks for precise intraday analysis. See how the merit order shifts across 96 daily blocks — from overnight low-demand periods to evening peak. Critical for real-time market (RTM) trading decisions.

  • view_timeline 96 blocks/day at 15-minute intervals for RTM precision
  • compare_arrows Compare merit order stacking across different time granularities
  • nightlight Low demand periods: 652 MW, 3/22 units, ₹1.08/kWh avg VC
  • wb_sunny Peak blocks: dramatic cost escalation visible in stacking pattern
Energy Atlas 15-minute block view showing merit order across 96 daily blocks
Optimization Engine

Configurable Optimization Parameters

Fine-tune the optimization engine with configurable margins, transaction costs, replacement volumes, and budget constraints. Set minimum margins for sale and replacement, cap daily budgets, and let the AI find the optimal dispatch strategy.

  • tune Min Margin for Sale: ₹0.1/kWh | Min Margin for Replacement: ₹0.15/kWh
  • calculate Transaction Cost: ₹0.0316/kWh factored into every trade decision
  • speed Max Replacement Volume: 2,000 MW per block
  • account_balance_wallet Max Replacement Budget: ₹29 Cr daily cap
Energy Atlas optimization settings — margin, transaction cost, volume and budget controls
Power Scheduling

Demand vs Generation Scheduling

The scheduling view overlays demand curve (pink line) against generation stack — RE, Must-Run, Tech Min, and Merit Order layers. Instantly see surplus/deficit positions across the day and plan trades to balance the book.

  • show_chart Demand curve overlay on stacked generation by type
  • electric_bolt Demand: 10,849 MW | Generation: 12,129 MW | Floor: 9,012 MW
  • swap_vert Trade position: Balanced — automatic surplus/deficit detection
  • touch_app Hover any block for instant demand vs generation comparison
Energy Atlas scheduling view showing demand curve overlaid on generation stacking
Trade Analytics

Energy Trade Reports & P&L

Comprehensive trade reporting with Must-Sell, Opp. Sell, Deficit Buy, Opt. Buy volumes. Track sale revenue, replacement savings, batting average, and budget utilization — the complete P&L of your power procurement operations.

  • receipt_long Must-Sell 1.31 MU | Opp. Sell 5.09 MU | Opt. Buy 9.73 MU
  • payments Sale Revenue ₹186.53 Lacs | Replacement Savings ₹172.99 Lacs
  • sports_score Batting Average 20.6% — trade execution effectiveness score
  • account_balance Budget Used ₹2.14 of ₹29 Cr daily allocation
Energy Atlas reports showing energy trades, batting average, and P&L metrics
Surrender Analytics

Volume Surrendered Tracking

Track which units surrendered volume across every block — critical for understanding capacity availability, outage patterns, and DSM compliance. Stacked bar charts show unit-wise surrender volumes with interactive tooltips breaking down MW contributions.

  • bar_chart Total 207,291 MW surrendered across 22 units daily
  • info Unit-wise breakdown: KUDGI 897 MW, UPCL_1 190, UPCL_2 195 at 13:00
  • grid_view Chart, Grid, Hourly, 15-min, Simple, and Heatmap views
  • sort Sort by VC or Flat rate for cost-optimized surrender decisions
Energy Atlas volume surrendered chart showing unit-wise breakdown across 24 hours
Generation Analytics

Generation Mix by Fuel & Cost

Analyze the generation schedule by fuel type (Hydro, Nuclear, Gas, Coal, Renewable) or by variable cost quartile (Q1 Low VC through Q4 High VC). Understand how the generation mix evolves through the day and optimize procurement strategy accordingly.

  • eco By Fuel: Hydro, Nuclear, Gas, Coal, Renewable area charts
  • sort By VC: Q1 (Low VC) 5,171 MW through Q4 (High VC) 3,171 MW
  • touch_app Block-level tooltip: Total 11,388 MW with fuel-wise breakdown
  • toggle_on Switch between By Fuel and By VC views with one click
Energy Atlas generation schedule by fuel type showing Hydro, Nuclear, Gas, Coal, Renewable
Final Schedule

Integrated Final Schedule View

The unified final schedule combines RE, Must-Run, Conventional generation with Net Buy/Sell positions, overlaid against Demand and Availability curves. This is the single source of truth for the day's power position — from scheduling to settlement.

  • layers Stacked layers: RE, Must-Run, Conventional, Net Buy, Net Sell
  • show_chart Demand (pink) and Availability (dashed) curves overlaid
  • grid_on Summary view: Conventional, Must-Run, RE, Net Trade, Total Availability, Demand, Surplus/Deficit per block
  • check_circle Zero surplus/deficit = perfectly balanced schedule
Energy Atlas final schedule showing RE, Must-Run, Conventional, Net Buy, demand and availability
Dispatch Heatmap

Unit-Level Dispatch Grid

A heatmap grid showing every unit's MW dispatch across all 24 hourly (or 96 fifteen-minute) blocks. Color coding highlights high-output blocks (green) vs off/low blocks (red), making dispatch patterns instantly visible at a glance.

  • grid_view Unit-by-block grid with color-coded MW values
  • palette Green = dispatched at capacity | Red = off or curtailed
  • visibility Spot dispatch anomalies and outage patterns instantly
  • download Export to Summary report for regulatory compliance filing
Energy Atlas grid heatmap showing unit-level dispatch across 24 hourly blocks

Platform Capabilities

End-to-end power scheduling and market operations in one platform

insights

Demand Forecasting

Sub-2% MAPE demand forecasting with multi-revision capability. Weather-adjusted, satellite-enhanced, with agri-load estimation for rural feeders.

wb_sunny

RE Forecasting

Solar (≤4.2% MAPE) and Wind (≤4.5% CR MAPE) forecasting with satellite cloud tracking and numerical weather model integration.

swap_horiz

Trade Optimizer

Multi-market trade optimization across DAM, TAM, RTM, and bilateral channels. Automated bid generation with margin and risk constraints.

speed

Risk-Return Simulator

Stochastic optimization with CVaR-LP for risk-return efficient frontier analysis across 2,000 scenarios per dispatch cycle.

map

Network Asset Mapping

GIS-based visualization of transmission lines, substations, and generation assets with real-time status monitoring.

monitor_heart

Wide Area Monitoring

Real-time grid frequency, voltage, and power flow monitoring with anomaly detection and hazard alerts.

Transform Your Utility Operations

Go live in 21 days. See every MW, every trade, every rupee — in real time.

calendar_today Schedule a Demo arrow_back Back to Home apps All Products