Stochastic Optimization & Risk Engine

PARETO

CVaR-LP powered stochastic optimization for energy portfolio management. Run thousands of Monte Carlo scenarios, explore the Pareto frontier between cost and risk, optimize dispatch, make market decisions, and manage fleet scheduling — all under configurable real-world constraints.

play_arrow Launch Interactive Demo
CVaR-LP
Optimization Engine
5
Analytical Modules
9
Constraint Categories
Exploreexpand_more
Simulator

Monte Carlo CVaR-LP Optimizer

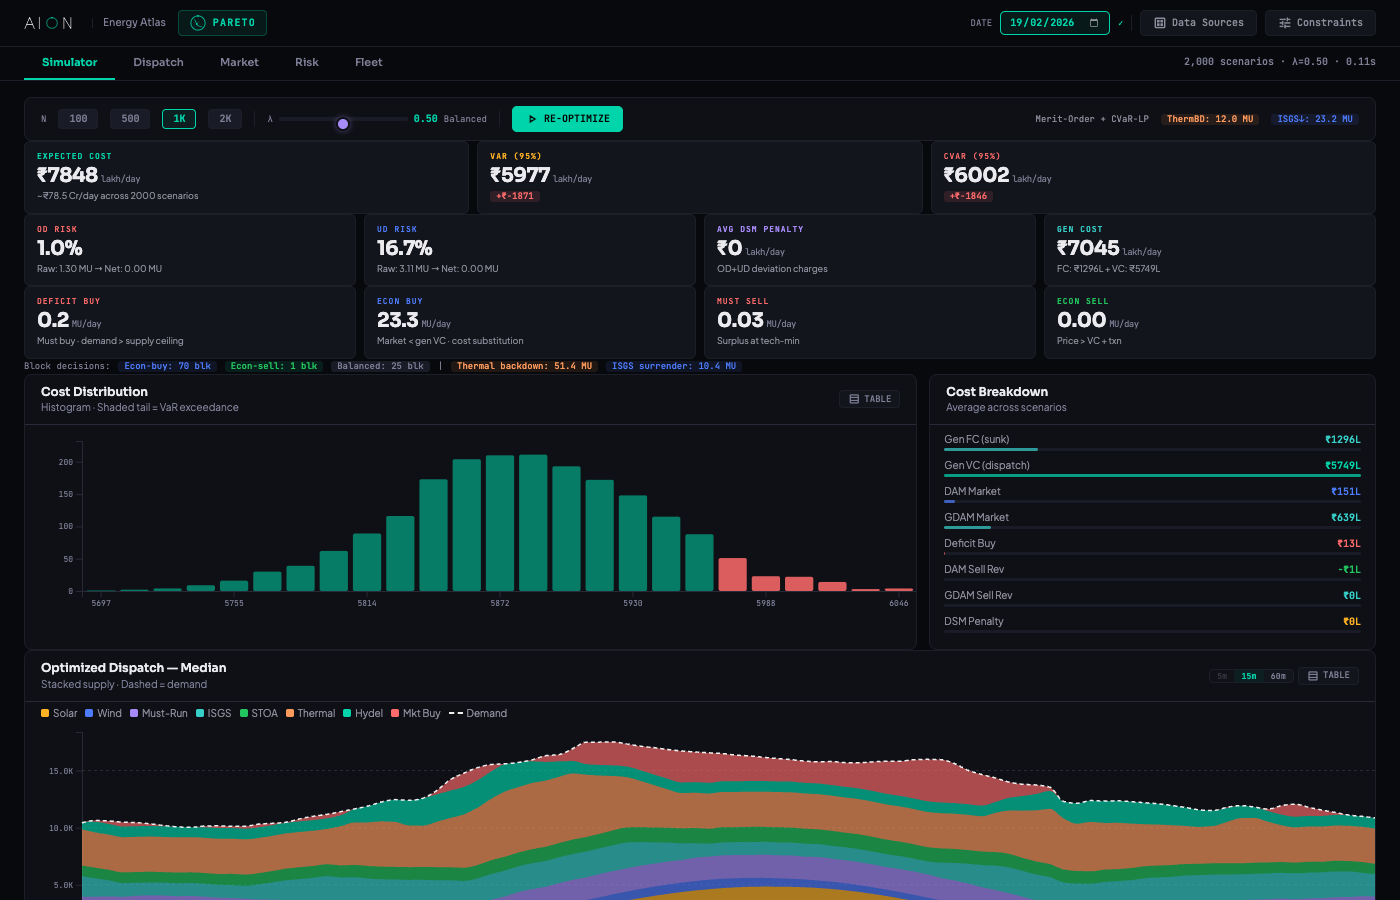
Run N stochastic scenarios with configurable risk appetite via the λ slider — from conservative (λ=0) to aggressive (λ=1). The Merit-Order + CVaR-LP engine computes optimal dispatch in under a second, producing cost distributions, VaR/CVaR metrics, and a complete cost breakdown across Gen FC, Gen VC, DAM, GDAM, Deficit Buy, Sell Revenue, and DSM Penalty.

  • casino Configurable scenario count with instant RE-OPTIMIZE — results in <0.15s
  • tune λ risk appetite slider — continuously adjusts cost-vs-risk tradeoff across the efficient frontier
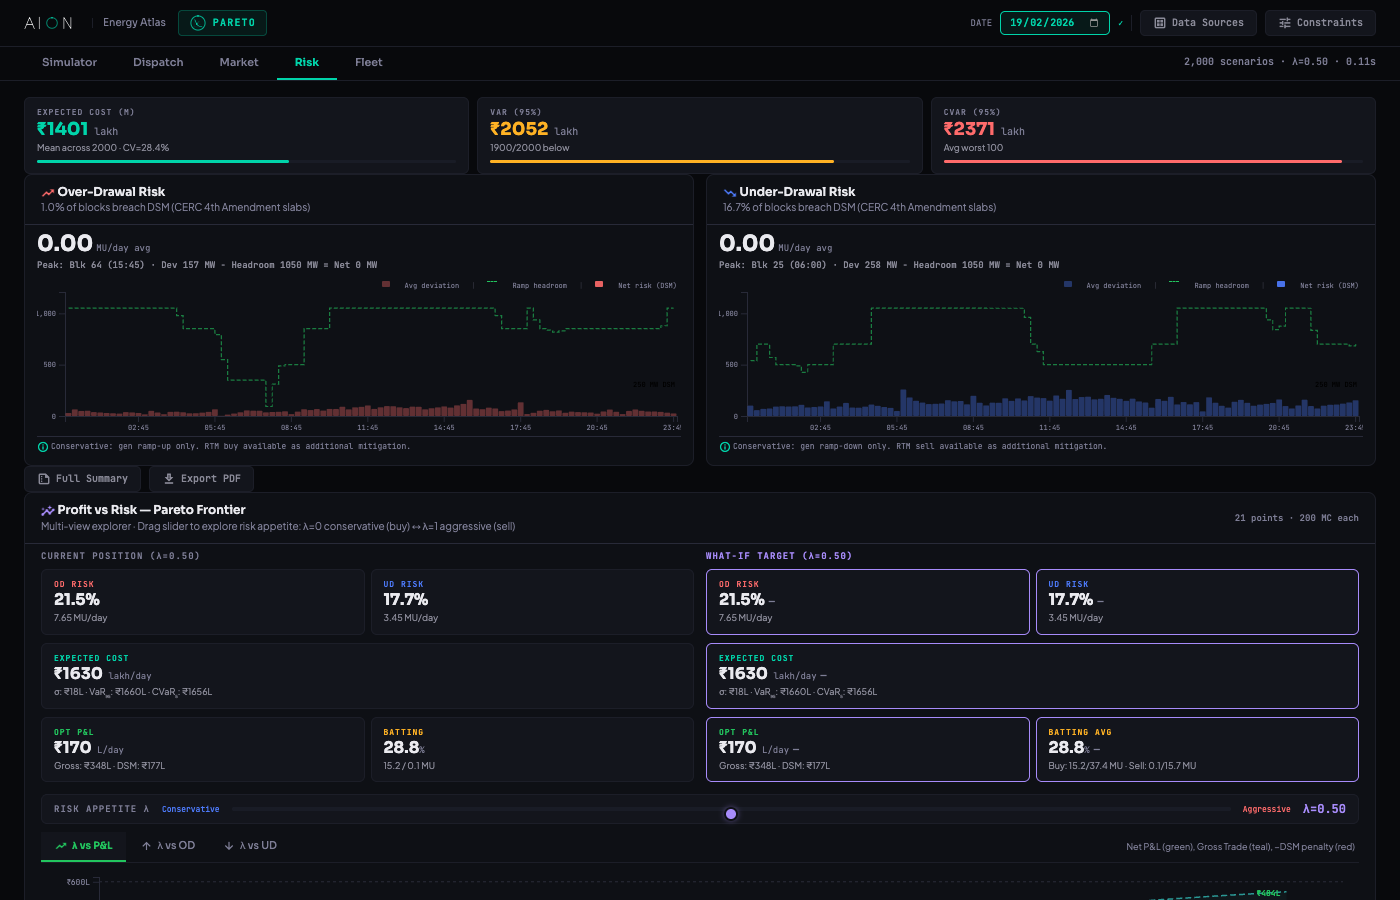
  • bar_chart Cost Distribution histogram with shaded VaR exceedance tail — visualize the full probability distribution
  • payments Cost Breakdown: Gen FC (sunk), Gen VC (dispatch), DAM Market, GDAM Market, Deficit Buy, DAM Sell Rev, GDAM Sell Rev, DSM Penalty
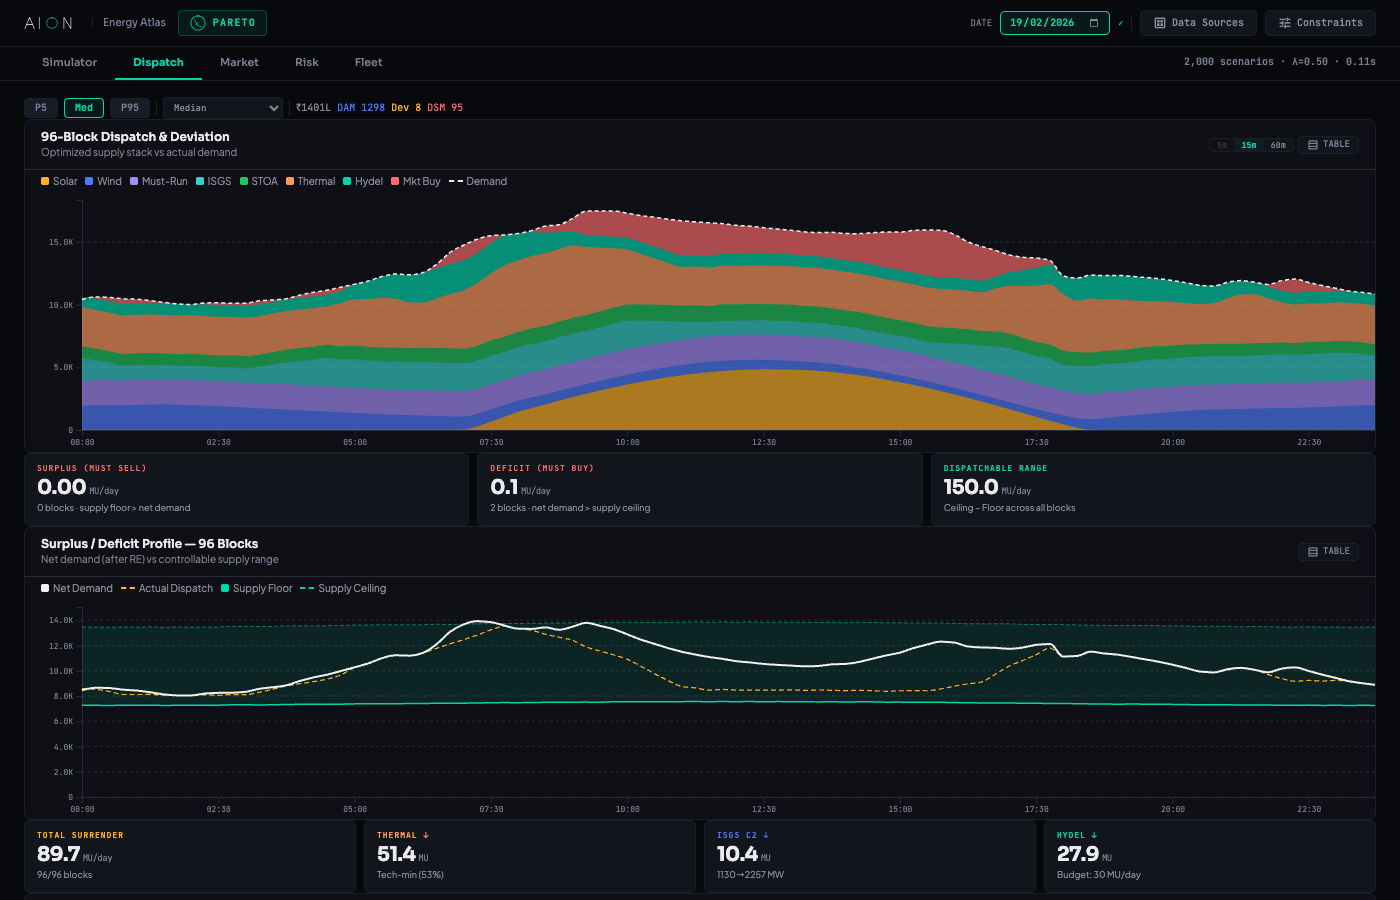
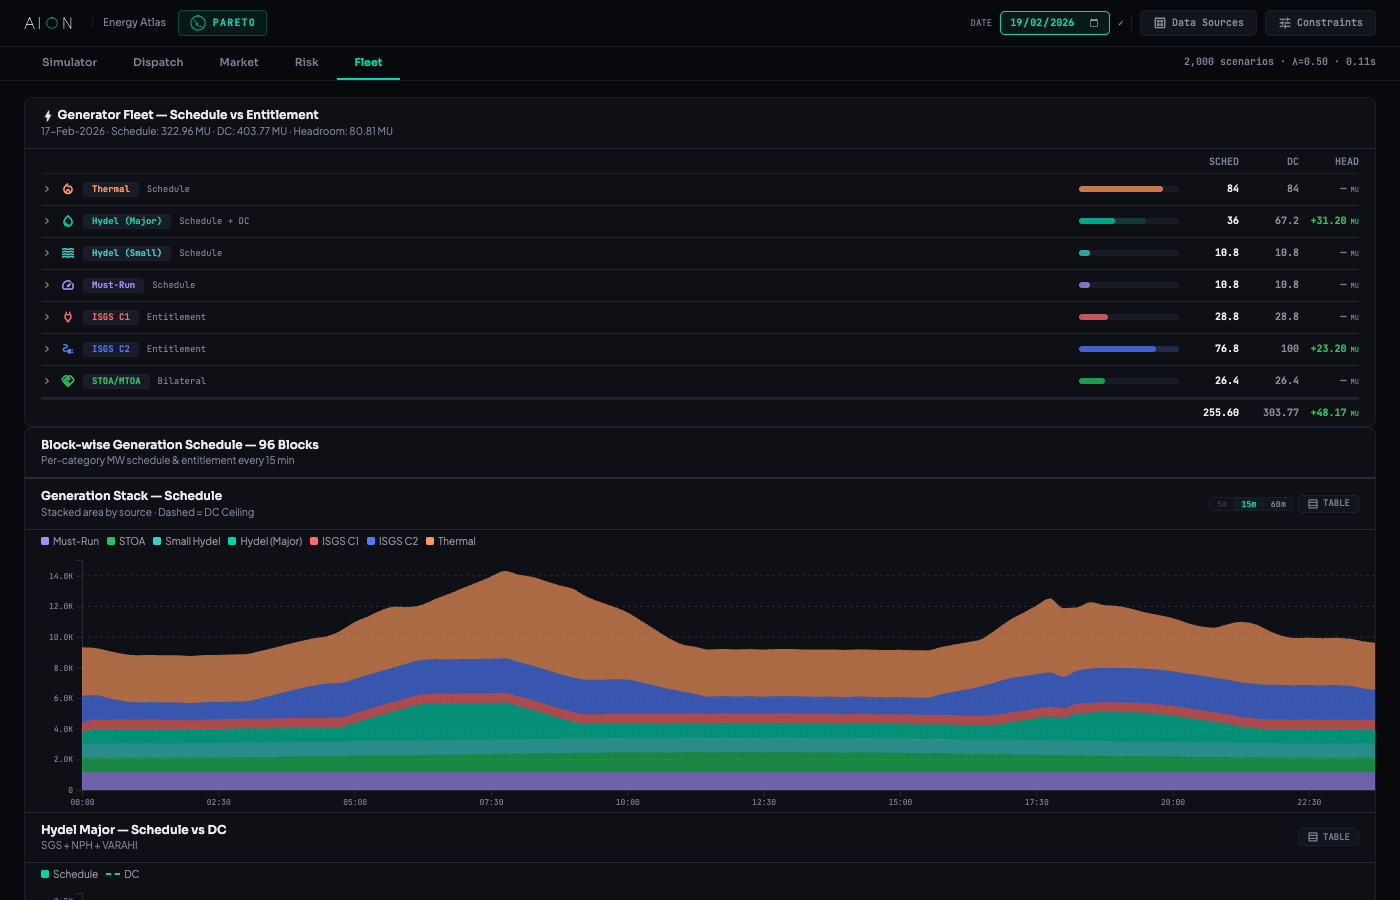
  • stacked_line_chart Optimized Dispatch — stacked supply vs. demand at 5m/15m/60s resolution (Solar, Wind, Must-Run, ISGS, STOA, Thermal, Hydel, Mkt Buy)
  • grid_on Block decision ribbon: Econ-buy blocks, Econ-sell blocks, Balanced blocks, Thermal backdown MU, ISGS surrender MU
PARETO Simulator showing CVaR-LP optimization with cost distribution, KPIs, cost breakdown, and optimized dispatch stack
Dispatch

96-Block Dispatch & Deviation Analysis

The Dispatch tab visualizes the full optimized schedule with scenario selection (P5, Median, P95 or specific scenario). Shows dispatch volumes, deviation from demand, surplus/deficit profiles, surrender profiles, and unit-level dispatch vs. entitlement for every generator.

  • view_timeline 96-block dispatch bar chart with stacked supply (Solar, Wind, Must-Run, ISGS, STOA, Thermal, Hydel, Mkt Buy) vs. demand overlay
  • swap_vert Surplus/Deficit Profile — net position across all 96 blocks showing must-sell surplus, must-buy deficit, and dispatchable range (MU/day)
  • low_priority Surrender Profile — Thermal backdown, ISGS C2 surrender, and Hydel budget-shaped backing separately tracked with per-source MU volumes
  • factory Unit-level dispatch vs. entitlement — per-generator MW comparison for Thermal, ISGS C2, and Hydel units
  • show_chart Block Data — deviation profile showing Demand vs. Scheduled Generation across all 96 blocks
  • table_chart Tabular view toggle for every chart — exact block-by-block MW values exportable
PARETO Dispatch tab showing 96-block dispatch and deviation, surplus/deficit profile, surrender profile, and unit-level dispatch
Market

Market Intelligence & RPO Compliance

The Market tab drives all trading decisions with comprehensive KPIs — Deficit Buy, Econ Buy (DAM+GDAM), Must Sell, Econ Sell, and Net Market Cost. RPO compliance tracking against MoP FY trajectory targets (FY 2025-26 to 2029-30) with Solar and Non-Solar progress bars. GDAM buy/sell decisions driven by REC-aware routing logic.

  • eco RPO Compliance — Solar RPO, Non-Solar RPO, Combined RPO vs. configurable FY targets with real-time progress tracking
  • swap_horiz GDAM Buy/Sell with REC-aware routing — when GDAM premium > REC value (₹0.37/kWh), sell in GDAM; when premium < REC, buy in GDAM to earn RECs
  • account_balance Daily Budget Bar — visual allocation across DAM/GDAM/RTM with configurable ₹ Cr daily cap
  • show_chart Price Forecasts — DAM, GDAM, RTM price curves (₹/MWh) with σ-band uncertainty visualization across all 96 blocks
  • pie_chart Market Position — 96-block stacked chart showing Deficit/DAM/GDAM buy and Must/Econ sell volumes with price overlay
PARETO Market tab showing RPO compliance, GDAM routing, budget bar, price forecasts, market position, and P&L vs Risk
P&L vs Risk

Per-Decision Profit & Block-Level Timeline

Two critical risk analytics in one view. The Market Decisions chart breaks down every trade into expected profit (teal, ↑) vs. CVaR 95% downside risk (red, ↓) per decision type — each bar is clickable for block-level drill-down. The Block Level timeline shows Expected P&L and CVaR across all 96 blocks at 15m/60m resolution, with peak annotations and buy/sell indicators.

  • account_balance Market Decisions: DAM Buy (Morning -₹64L, Evening -₹20L), GDAM Buy (+₹337L dominant), Deficit Buy (-₹7L), Must Sell — per-decision P&L vs CVaR
  • trending_up GDAM Buy dominance: +₹337L expected P&L — green energy procurement earning REC credits, highest-value trade position
  • touch_app Each decision bar is clickable — reveals per-block decomposition of that decision type
  • timeline Block Level P&L: Blue filled Expected P&L peaking at +₹16.6L (2468MW · 11:45), CVaR dipping to -₹18.5L at 07:00
  • grid_on Buy blocks (blue) vs Sell blocks (green) indicator strip — instant visual of 96-block trading activity
  • summarize Day totals: +₹290L P&L, +₹87L risk, net +₹377L — aggregated from all block-level trades
PARETO P&L vs Risk — Market Decisions bar chart and Block Level 96-block timeline showing expected profit vs CVaR downside risk
Risk

Pareto Frontier & Risk Analytics

The Risk tab is the analytical core — starting with Expected Cost (μ), VaR(95%), and CVaR(95%) summary cards showing variance and confidence metrics. Dedicated Over-Drawal and Under-Drawal risk cards with block-level drill-down charts and peak block analysis. The interactive Pareto Frontier explorer lets you navigate the full efficient frontier with what-if analysis at any λ.

  • monitoring Cost risk triad: Expected Cost with CV%, VaR(95%) with n/N below, CVaR(95%) as average worst-case tail
  • trending_up OD Risk card — Over-Drawal risk with block drill-down, peak block analysis, conservative gen ramp-up mitigation
  • trending_down UD Risk card — Under-Drawal risk with block drill-down, RTM sell as additional mitigation path
  • scatter_plot Pareto Frontier — Multi-View: λ vs P&L, λ vs OD Risk, λ vs UD Risk with interactive point selection. Current Position (λ=0.50) vs What-If Target side-by-side comparison
  • tune What-If Panel: select any λ on the frontier, instantly see OD Risk, UD Risk, Expected Cost, Opt P&L, and Batting Average with delta indicators
  • lightbulb Auto-generated Verdict — dynamic insight based on frontier analysis ("sweet spot", "diminishing returns", etc.)
PARETO Risk tab showing cost risk cards, OD/UD risk with block drill-down, Pareto Frontier multi-view with what-if panel, cost distribution tail analysis, and risk decomposition
Risk Decomposition

Variance Attribution & Tail Analysis

Decompose total portfolio risk into its constituent sources using isolated Monte Carlo simulation. Understand exactly how much volatility comes from forecast model uncertainty (demand & RE prediction errors) vs. market price volatility (DAM/GDAM/RTM). The cost distribution chart shows tail behavior with VaR exceedance shading — essential for understanding worst-case scenarios.

  • donut_large Forecast Model Risk: Demand σ and RE forecast error — the variance from prediction inaccuracy. Configurable demand σ% and block noise MW
  • show_chart Market Price Risk: DAM/GDAM/RTM price volatility — the variance from market uncertainty. Factors perturbed independently
  • bar_chart Cost Distribution — histogram with VaR exceedance tail shading, showing the full probability distribution across all scenarios
  • summarize Full Risk Summary modal — consolidated view: Cost Risk, Deviation Risk, Generation, Market Decisions, RPO Compliance, Budget Allocation — exportable as PDF
  • info Cross-term variance allocated proportionally. Baseline deterministic cost shown for reference
RISK DECOMPOSITION — VARIANCE ATTRIBUTION Isolated MC
FORECAST MODEL RISK
80.4%
σ = ₹31.1L · CV = 2.2%
MARKET PRICE RISK
19.6%
σ = ₹15.3L · CV = 1.1%
Demand σ
RE Forecast
Block Noise
DAM
GDAM
Variance decomposition via isolated MC (500 scenarios each). Factors perturbed independently — cross-terms allocated proportionally.
Fleet

Generator Fleet Schedule & Entitlement

The Fleet tab provides a complete view of all generators — Thermal, Hydel (Major), Hydel (Small), Must-Run, ISGS C1, ISGS C2, and STOA/MTOA sources. Track schedule vs. entitlement vs. declared capacity for every category with expandable per-unit drill-down, generation stack chart, and dedicated views for hydel major and bilateral contracts.

  • factory Generator Fleet table — 7 source categories with SCHED, DC, HEADROOM columns and per-unit expansion (17+ units)
  • stacked_bar_chart Generation Stack — stacked area by source (Must-Run, STOA, Small Hydel, Major Hydel, ISGS C1, ISGS C2, Thermal) with DC ceiling dashed overlay
  • water_drop Hydel Major — SGS + NPH + VARAHI schedule vs. DC with reservoir-aware dispatch constraints
  • swap_horiz STOA / MTOA / Banking — bilateral contract supply visualization across 96 blocks
  • analytics Fleet aggregates: Schedule MU, DC MU, Headroom MU with color-coded variance indicators
PARETO Fleet tab showing generator fleet schedule vs entitlement, generation stack by source, hydel major, and STOA/MTOA/Banking
Constraints Engine

Configurable Dispatch Constraints

PARETO's constraint engine transforms theoretical optimization into real-world dispatch. Nine distinct constraint categories capture every operational, regulatory, seasonal, contractual, network, and penalty constraint — each fully configurable and re-optimizable on the fly with a single RE-OPTIMIZE click.

  • bolt Generation — Hydel budget (MU daily cap), thermal min load (% tech minimum), market transaction cost (₹/kWh)
  • payments Gen Costs — Per-source variable cost: Thermal, Hydel, Must-Run, ISGS, Wind/Solar (₹/kWh configurable)
  • water_drop Seasonal — Hydel units with high reservoir → must-run at DC. Monsoon/Post-Monsoon/Normal season modes. Floor types: At DC, As per Schedule, MU/day, MW/block
  • verified SLA — DISCOM tech-min failure → backdown restriction. Max backdown limits per unit (MU/day or MW/block)
  • electrical_services Network — Transmission bottlenecks force co-located generation ramp-up. Min generation floors per zone/unit regardless of merit order
  • account_balance Market Budget — Daily cap (₹ Cr), budget toggle, DAM/GDAM/RTM allocation sliders with auto-optimal reset based on price spread + REC logic
  • eco RPO & REC — FY 2025-30 MoP RPO trajectory (Wind, Hydro HPO, Distributed RE, Solar+), REC value, compliance toggle, GDAM sell/buy routing rules
  • gavel DSM Penalty — CERC 4th/3rd Amendment presets, OD/UD deviation bands with frequency linking, settlement inputs (ACP/DAM/RTM/Weighted), tolerance band (MW & %), persistent OD surcharge, reactive penalty, UI charge. Full formula preview
  • ssid_chart Forecast Error — Demand σ% and per-block MW noise — controls the Monte Carlo scenario generation uncertainty
⚙ CONSTRAINTS 9 Categories · Re-run to Apply
bolt GENERATION 3 params
Hydel Budget22 MU
Thermal Min %55%
Txn Cost₹0.10/kWh
payments GEN COSTS 5 params
Thermal ₹4.50 · Hydel ₹1.20 · ISGS ₹3.80₹/kWh
water_drop SEASONAL Reservoir-aware
High reservoir → must-run. Season: Normal/Monsoon/Post-Monsoon
verified SLA Backdown limits
electrical_services NETWORK Transmission floors
account_balance MARKET BUDGET DAM/GDAM/RTM
Daily Cap₹25 Cr
eco RPO & REC FY 2025-30
Total RPO33.01%
REC Value₹0.37/kWh
gavel DSM PENALTY CERC 4th Amend.
OD/UD Bands · Freq Linked · Tolerance12 MW / 2%
Persistent OD Surcharge25%
ssid_chart FORECAST ERROR MC params
Demand σ3.5%
Block Noise100 MW
Data Sources

Multi-Source Data Integration

PARETO consumes multiple real-time and forecast data streams — demand forecasts, renewable energy generation forecasts, market price feeds, generator fleet specifications, and weather data. All sources are configurable and versioned via a dedicated Data Sources modal.

  • show_chart Demand Forecast — block-level load prediction with confidence intervals
  • wb_sunny RE Forecast — solar irradiance and wind speed to generation conversion models
  • trending_up Market Price — DAM, GDAM, RTM price forecasts with historical spread analysis
  • factory Generator Fleet — unit specifications with DC, entitlement, heat rate, ramp rates, minimum technical load
  • cloud Weather Data — temperature, humidity, wind speed feeds for demand and RE correction
DATA SOURCES 5 Feed Types
show_chart
Demand Forecast
96-block load prediction · σ-bands
● LIVE
wb_sunny
RE Generation Forecast
Solar + Wind · irradiance/speed models
● LIVE
trending_up
Market Price Feeds
DAM / GDAM / RTM · historical spread
● LIVE
factory
Generator Fleet Data
DC, entitlement, heat rate, ramp rate, tech-min
● LIVE
cloud
Weather Feeds
Temp, humidity, wind · demand correction
● LIVE

PARETO Analytical Modules

Five integrated modules working together to deliver optimal dispatch under real-world constraints.

casino

Simulator

Monte Carlo CVaR-LP optimizer. Configurable scenarios, λ risk slider, cost distribution with VaR tail, cost breakdown, and stacked dispatch at 5m/15m/60s.

view_timeline

Dispatch

96-block schedule with scenario selection (P5/Med/P95), deviation analysis, surplus/deficit, surrender tracking (thermal/ISGS/hydel), unit-level dispatch vs. entitlement.

swap_horiz

Market

RPO compliance, GDAM routing with REC logic, budget allocation, price forecasts with σ-bands, market position, P&L vs Risk per decision (clickable), block-level P&L.

scatter_plot

Risk

Pareto frontier (λ vs P&L/OD/UD), what-if analysis, OD/UD block drill-down, cost distribution tail, risk decomposition (forecast vs. market price variance attribution).

factory

Fleet

Generator fleet management with expandable per-unit rows, generation stack by source, hydel major (SGS/NPH/VARAHI), STOA/MTOA/Banking bilateral contracts.

tune

Constraints

9 constraint categories: Generation, Gen Costs, Seasonal, SLA, Network, Market Budget, RPO & REC, DSM Penalty (CERC), and Forecast Error — all re-optimizable on the fly.

Optimize Your Energy Portfolio

See how PARETO reduces procurement cost while managing risk within regulatory constraints.

play_arrow Try Interactive Demo mail Schedule Consultation arrow_back Back to Home